Learning Process Reflection:
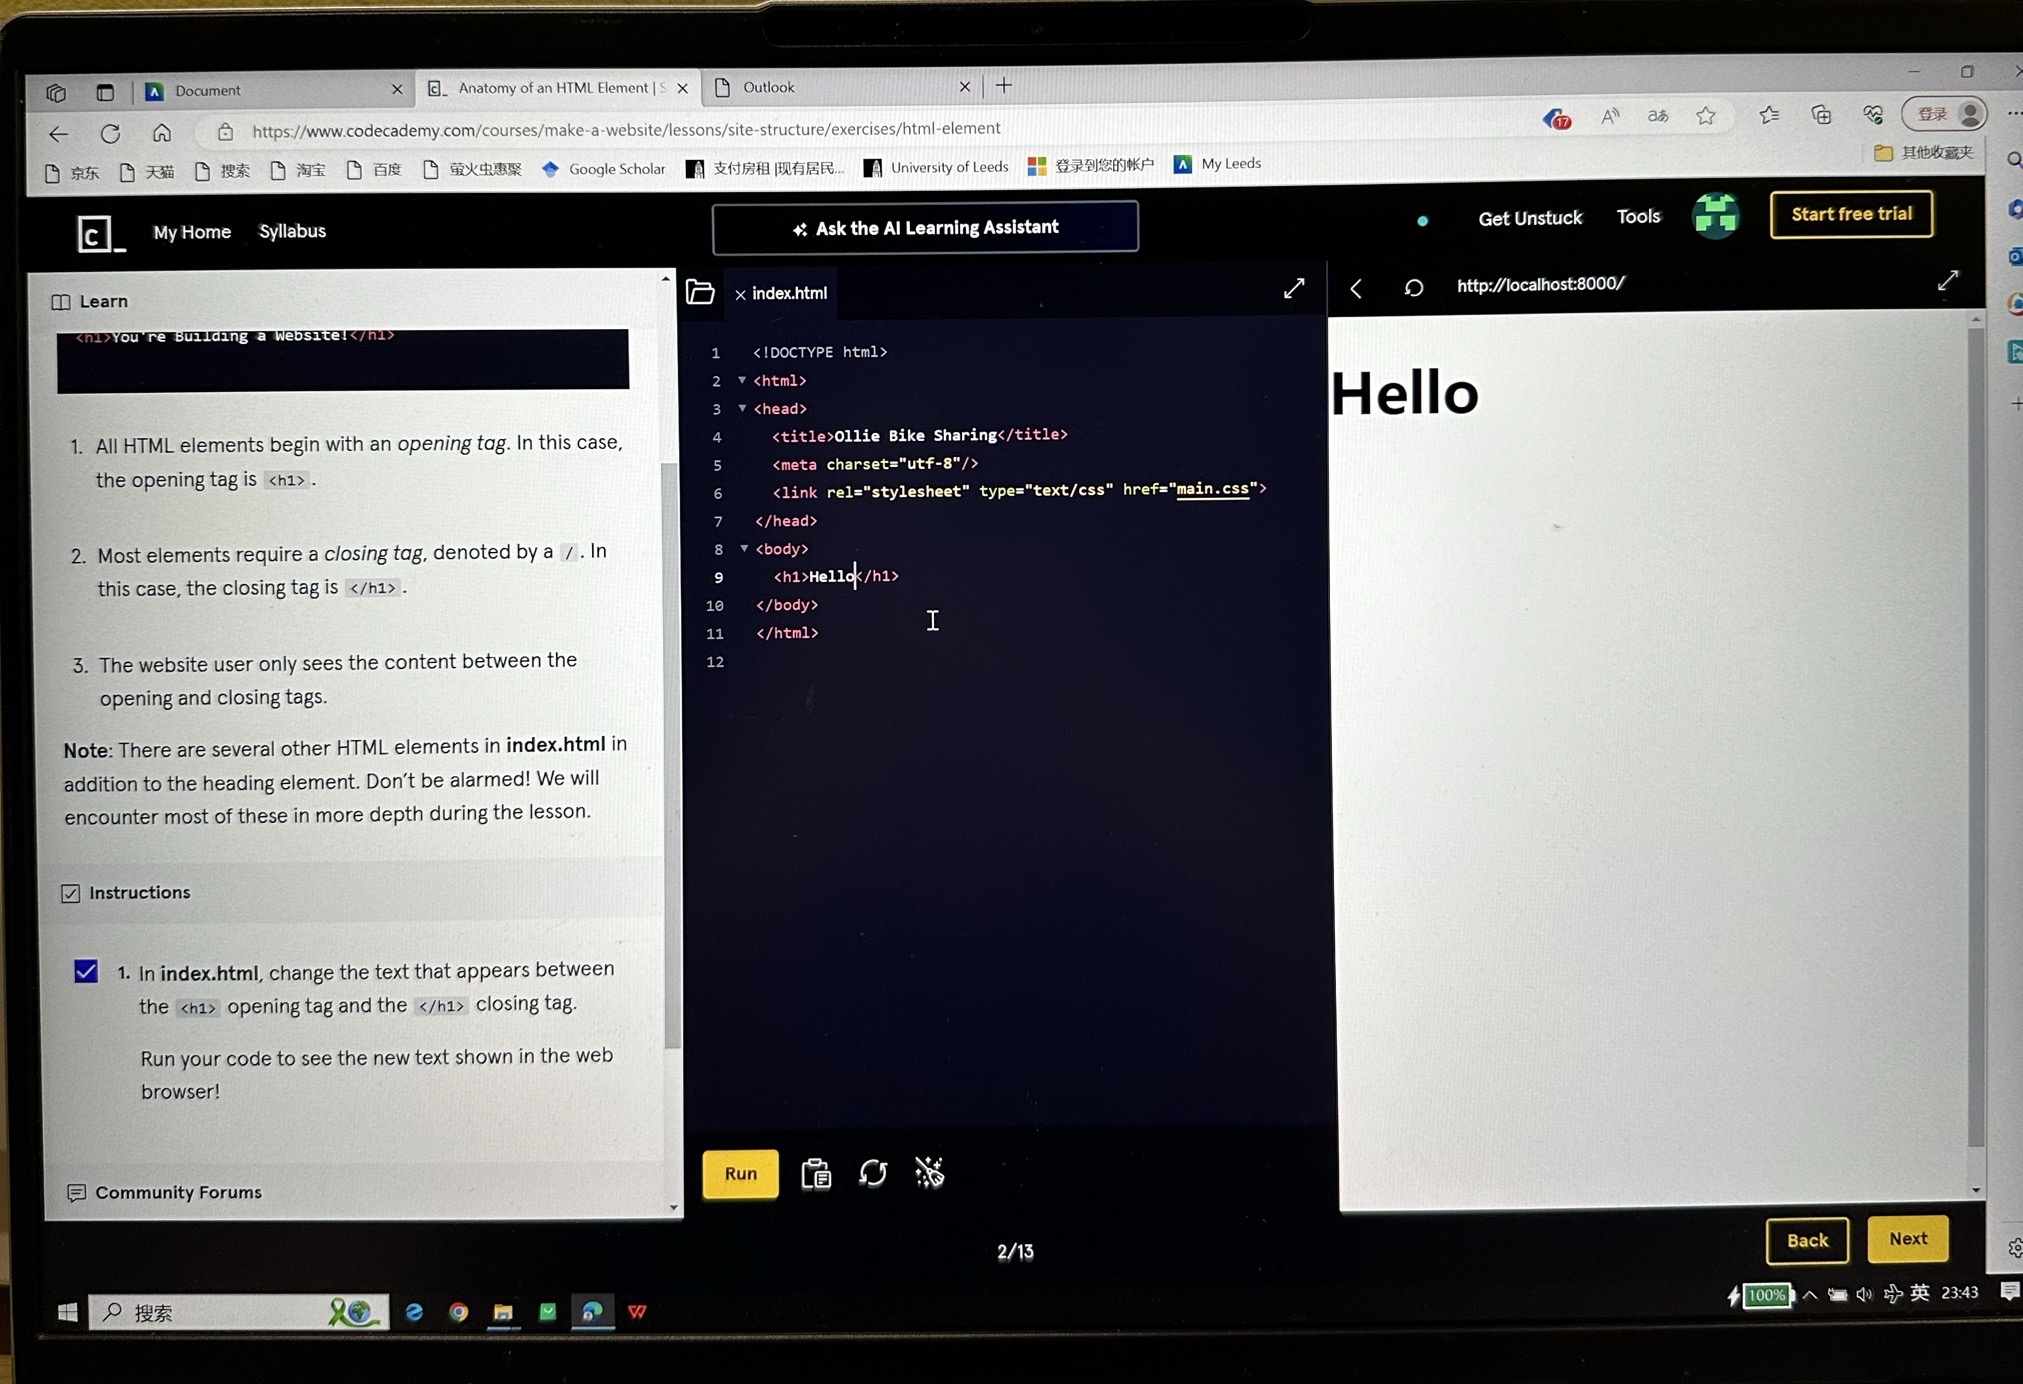
I used the free Codecademy course to get a primer on HTML and CSS in preparation for the workshop (pictured above). I learnt about the HTML web skeleton, where all web content is defined and presented. Learning how to use tags correctly made me realise that web design is not only about visual presentation, but also about implementing the code wisely through clear codes that are easy to maintain and extend the structure. Secondly, I also learnt that website creation is not only about coding, but also about web experience and accessibility. In addition, I have learnt about the role of css in beautifying the appearance of web pages.
Gillespie emphasised that more than mere tools, algorithms are also stabilizers of trust, practical and symbolic assurances that their evaluations are fair and accurate, free from subjectivity, error, or attempted influence. When I was browsing the shopping site ‘Amazon’, I found that The site's recommendation system (which includes personalised recommendations based on browsing history, purchase history, and user behaviour) collects data on user behaviour, and algorithms can predict user interests and accurately target products that may be of interest. Users typically trust these recommendations, believing that they are based on a large amount of data rather than mere personal preferences or sales targets. I think this is one of the reasons I like using the site for shopping. The second is the relative simplicity of the homepage design, which is laid out through a clear navigation bar, categorised menus, and a search box, despite the huge amount of content.
However, one point for improvement is that the site needs to reinforce the cultural background and user habits of different regions by customising the page layout and recommended content.
Challenges:
Despite my previous basic learning of HTML and CSS, I encountered some confusion. A common point of confusion was understanding the usage of semanticised tags. Tags like 'article', 'ection', and 'header' help organise content in a meaningful way, but I couldn't always figure out when and how to use them. Anyway, looking forward to the rest of the study!
Learning Process Reflection:
I identified data processes and operations within the TV website interface, i.e. web data scraping. Although Python is a very common data scraping language, I also identified three web scraping tools that do not rely on programming: OutWit, Webscraper and Scrapehero: Firstly, OutWit is a browser-based scraping tool with a very intuitive interface, which I think is very suitable for zero-based users.
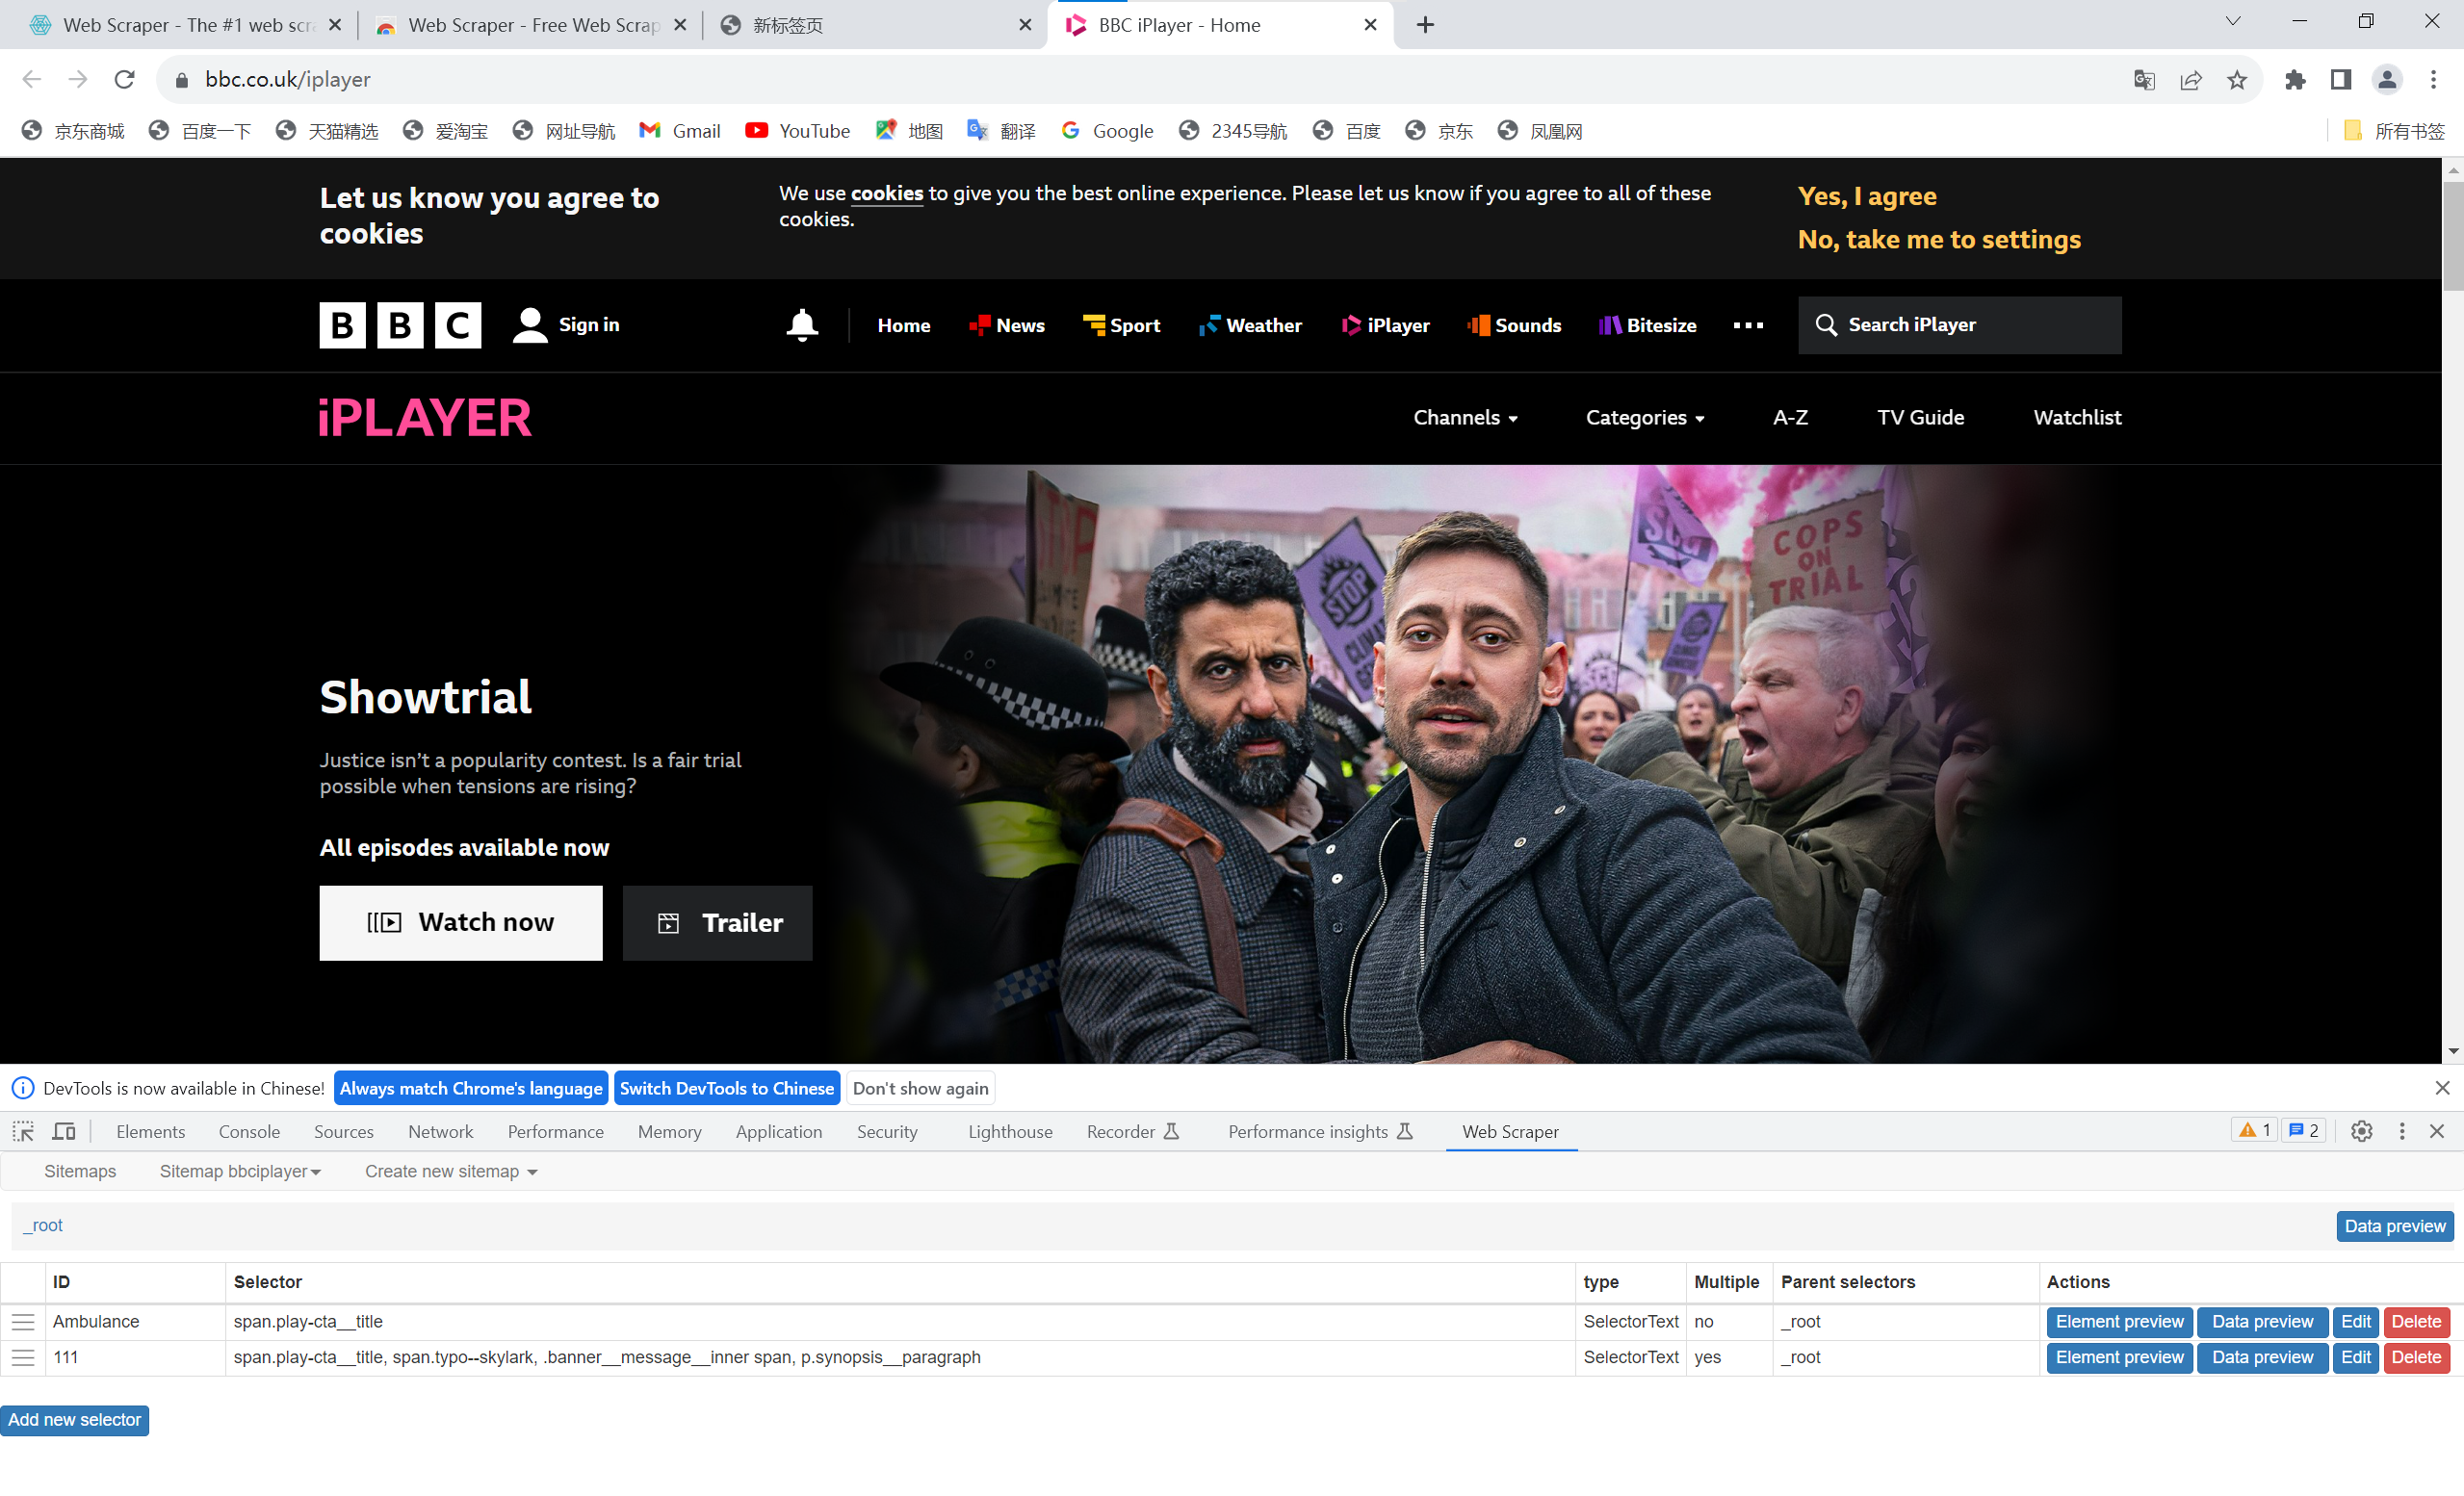
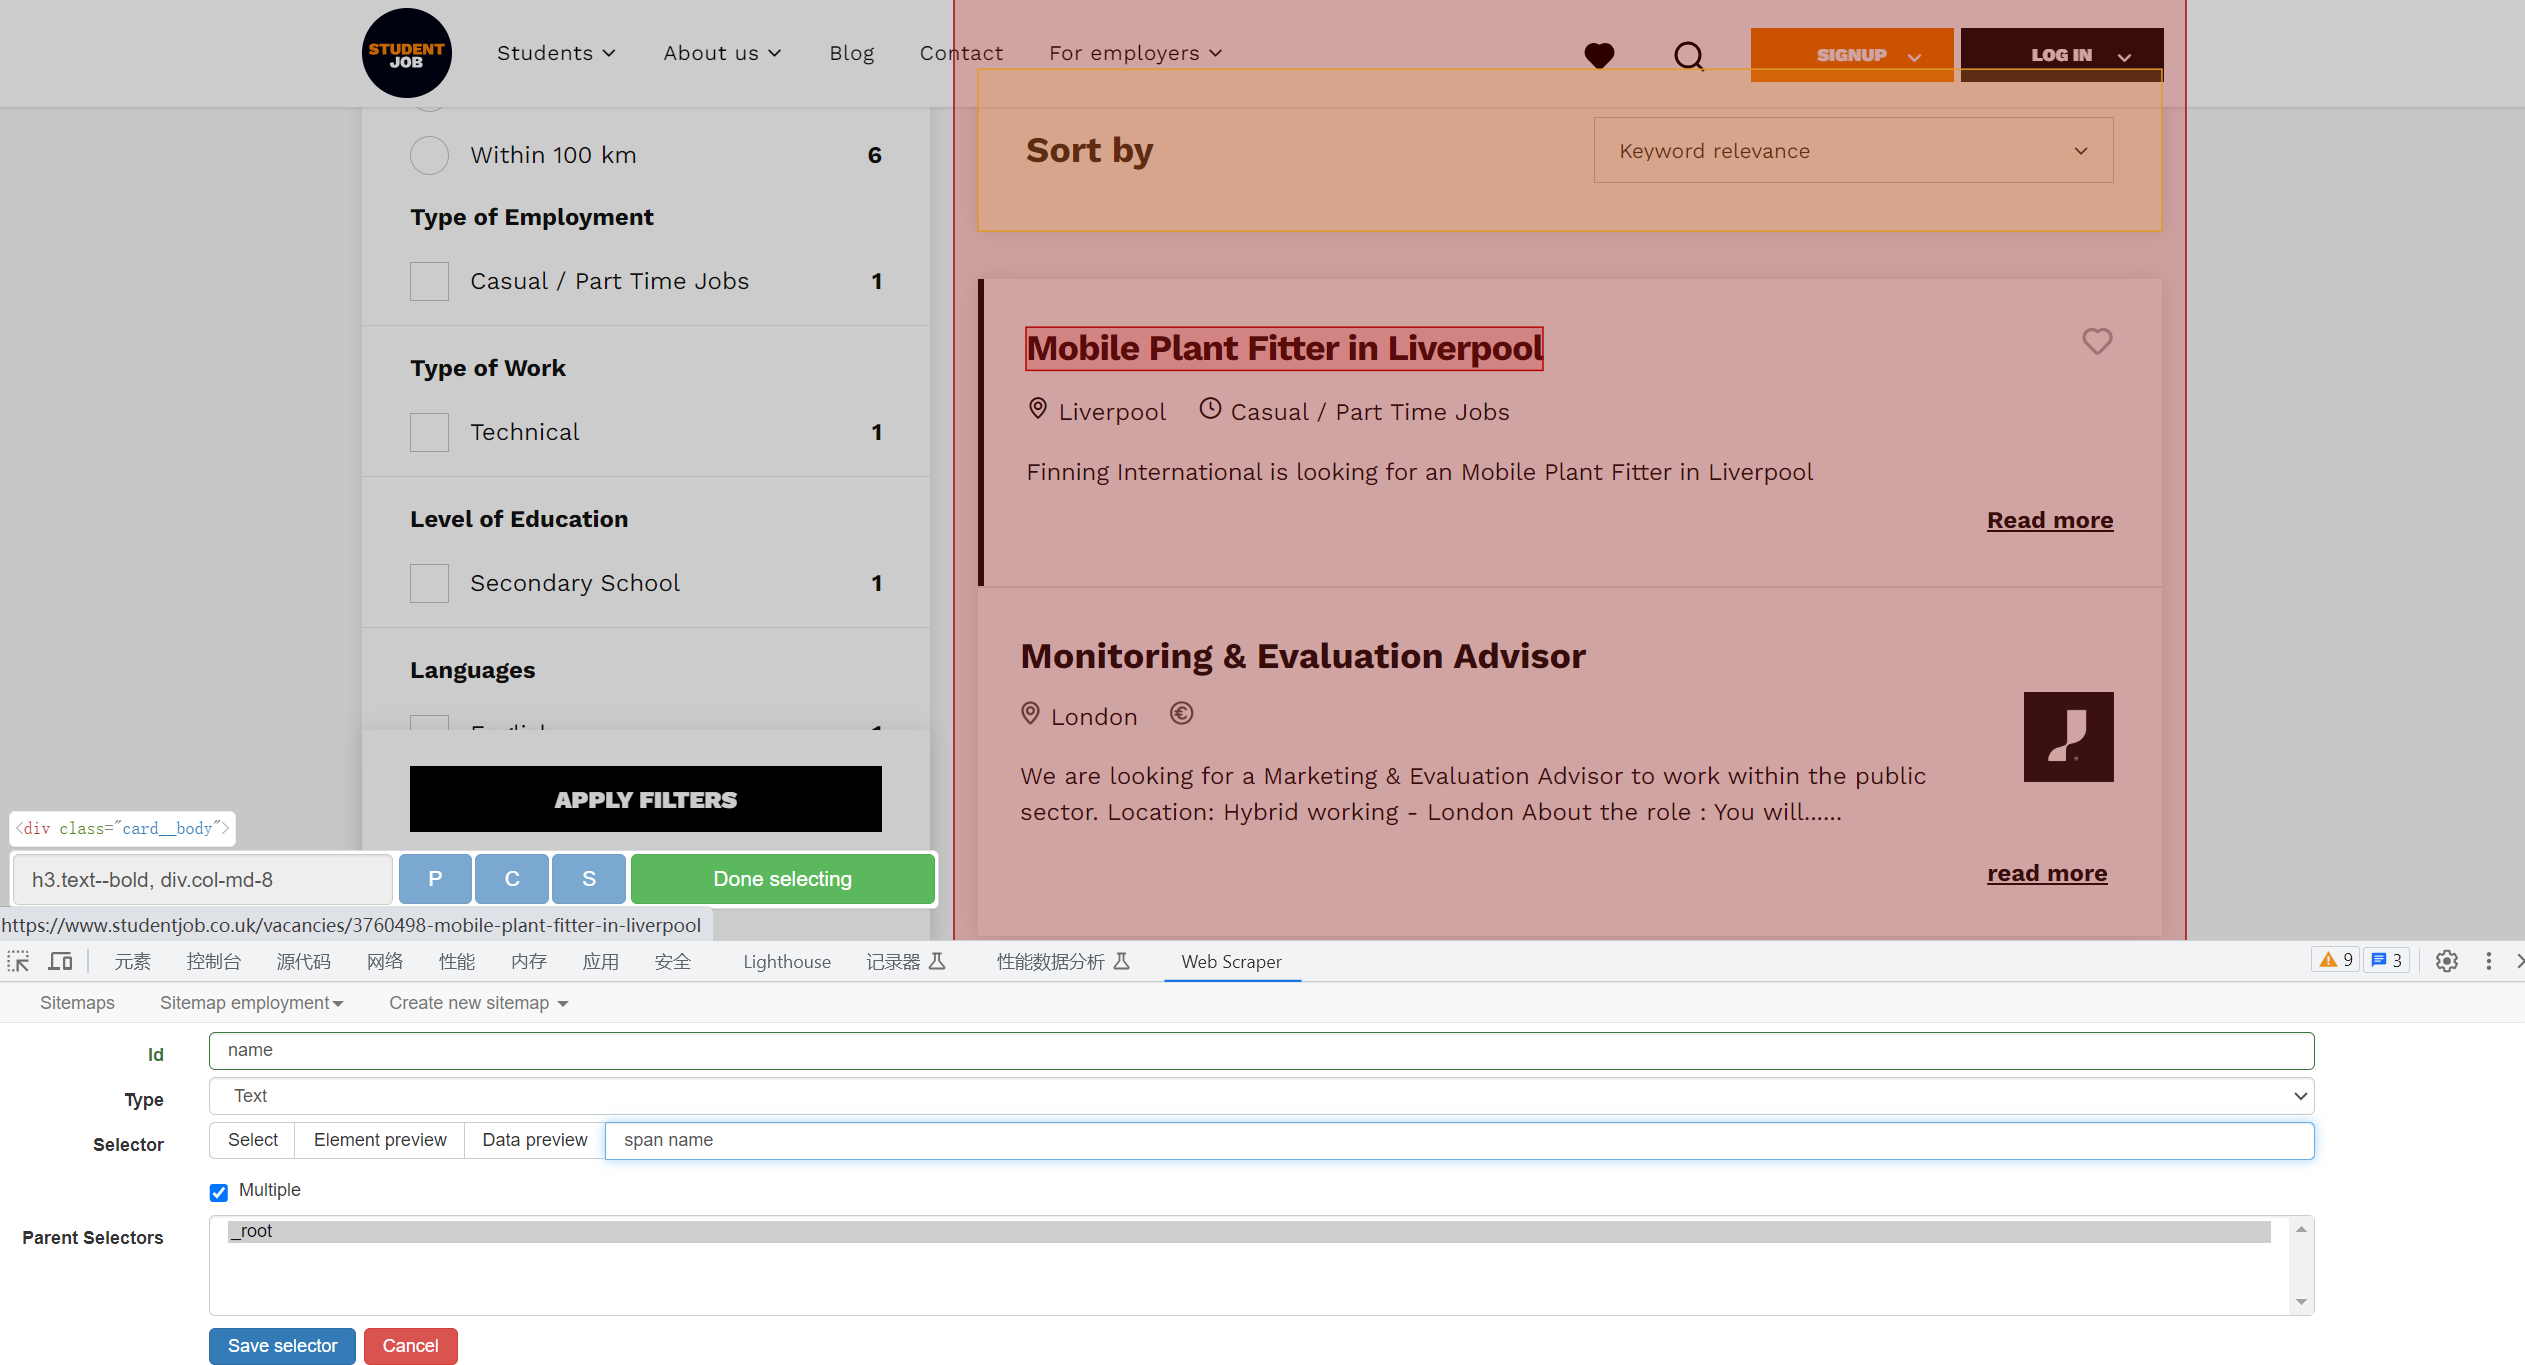
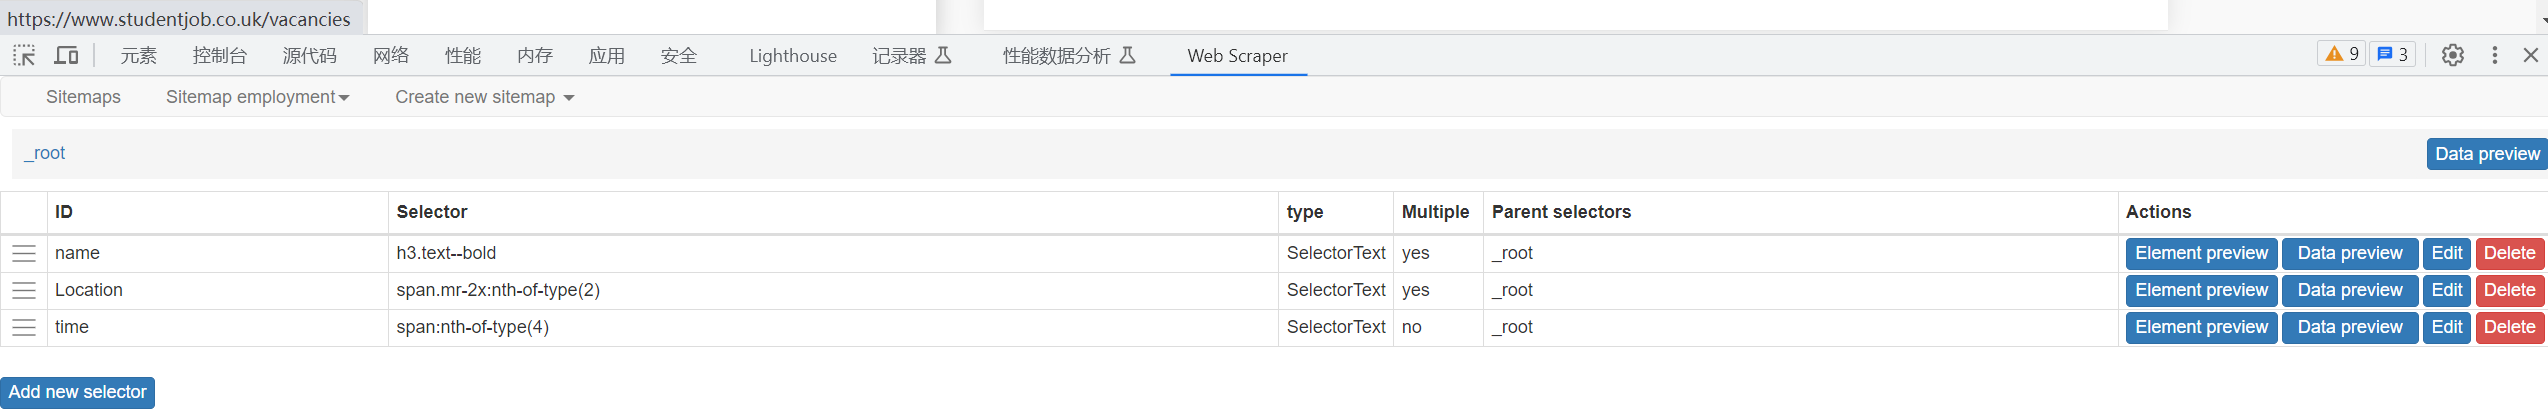
Second, with Web Scaper, a free-to-run Google Chrome add-on, users can dynamically scrap complex scenes from web pages. I experienced the flexibility of the tool in my classroom, but felt that there may be performance limitations when performing large-scale web scraping.
Unlike the previous two tools, Scrapehero is suited for large-scale and complex tasks and can handle API data and image scraping. Its cloud deployment feature makes it ideal for businesses or users who need to run crawlers for long periods of time. I think it's suitable for large-scale projects. Through this lesson, I realised that many easy-to-use tools are equally capable of meeting search needs. For smaller tasks, OutWit and Webscraper are sufficient, while for more complex needs, I would consider exploring a hybrid approach using Python and these tools.
Challenges:
As Chapple suggestsyou should always consider the ethics and legality of web scraping. so there is a need to categorise the specifics at the time of scraping and in the subsequent extraction of the data I should consider the proprietary data of the company that is acquiring the regular website.Bucher argues that algorithms influence social interactions, behavioural patterns and cultural practices, and even the way we interact with others. At the same time, algorithms actually exercise power by determining the ordering, presentation, and visibility of information. For example, social media algorithms control which posts, news, or advertisements appear to users, which means that algorithms have enormous power in influencing users' thoughts, behaviours, and opinions.
The following is a screenshot of me scraping a web page using Web Scraper.
Learning Process Reflection:
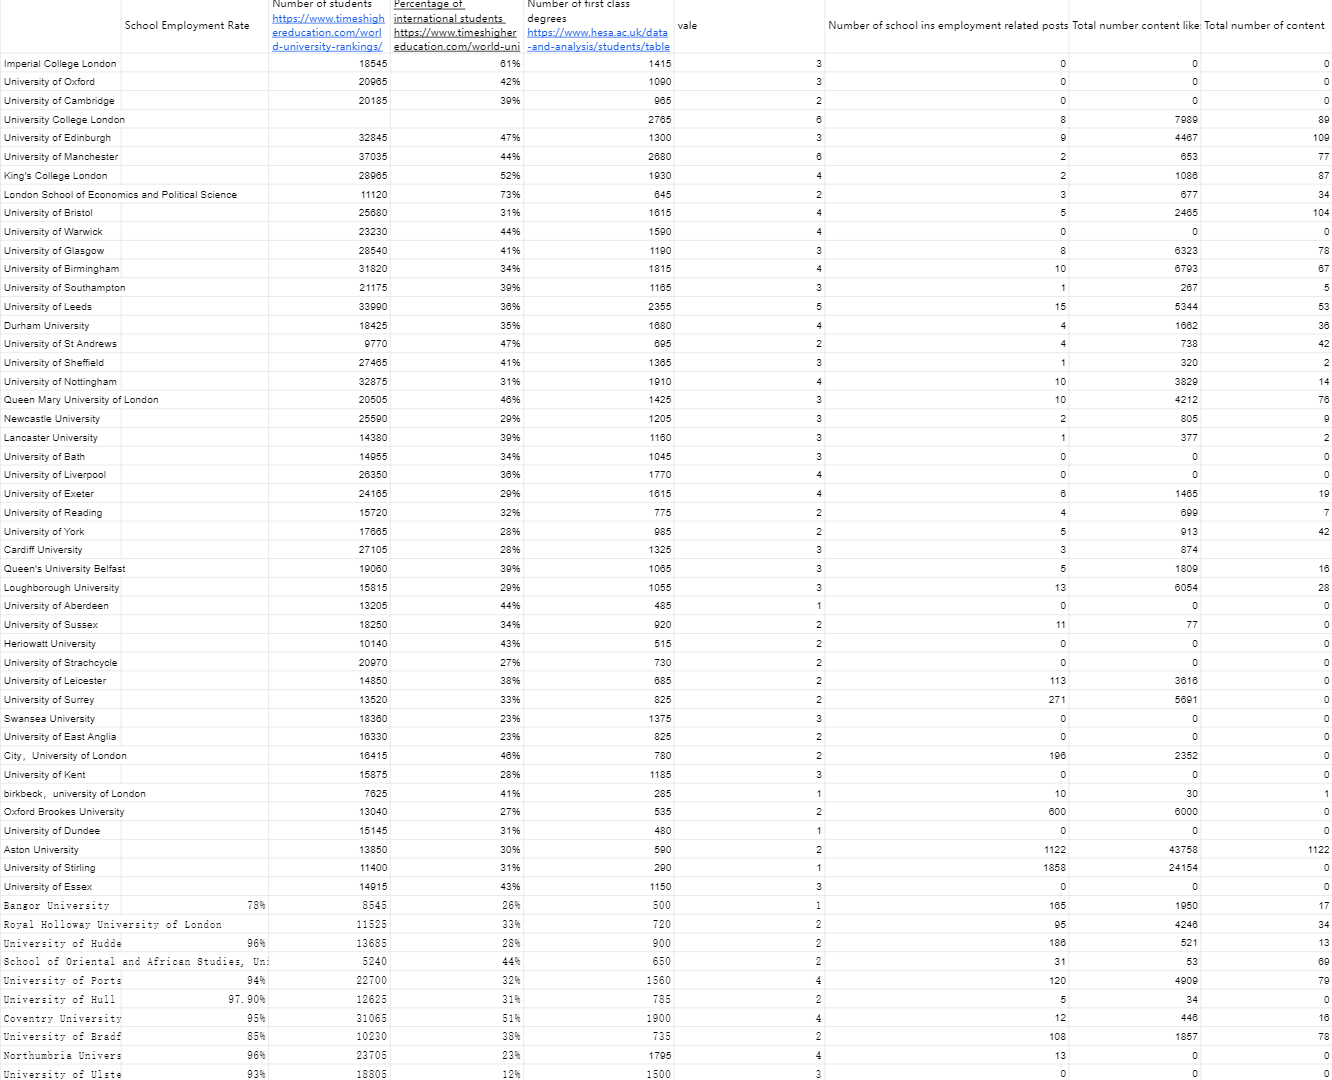
This workshop focuses on the effective visualisation of the data collected by the group, learning the definitions of ‘dataset’, ‘variable’ and ‘chart type’. In the group task, the employment of students at UK universities was collected with the aim of helping the audience to better understand the current digital engagement in the job market and related employment trends. Our audience is primarily university students, and we hope that the presentation of the data will help them gain a clearer understanding of the employment situation in different disciplines and regions, and thus inform their career planning. In order to motivate our audience to take action, we wanted them to not only think about the current state of the employment situation for UK university students, but also to realise the impact of digital skills on employment opportunities. Information that audiences need to understand includes: differences in employment rates across disciplines, growing trends in the demand for digital skills, and geographic variations in the job market. By presenting the data clearly and visually, viewers can see which disciplines have better job prospects and which may face greater challenges, and thus make more informed career planning or educational decisions.
Reflecting on Generating a Dataset:
Data collection and screening is a tedious process. We needed to ensure that the data were representative and accurate, while avoiding bias in the data sources. From the task, I learnt that data can reflect social and economic trends. On the contrary, data is shaped by specific social, economic and cultural contexts. As data analysts and visualisers, we need to always think critically about our biases and positions in data selection and presentation.
Reflecting on data visualisation:
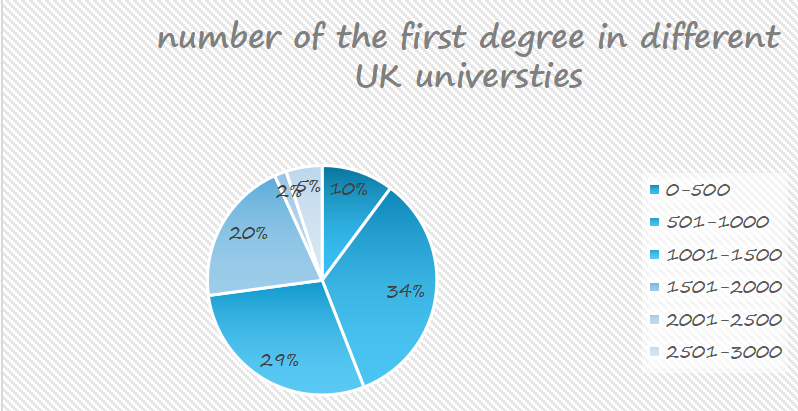
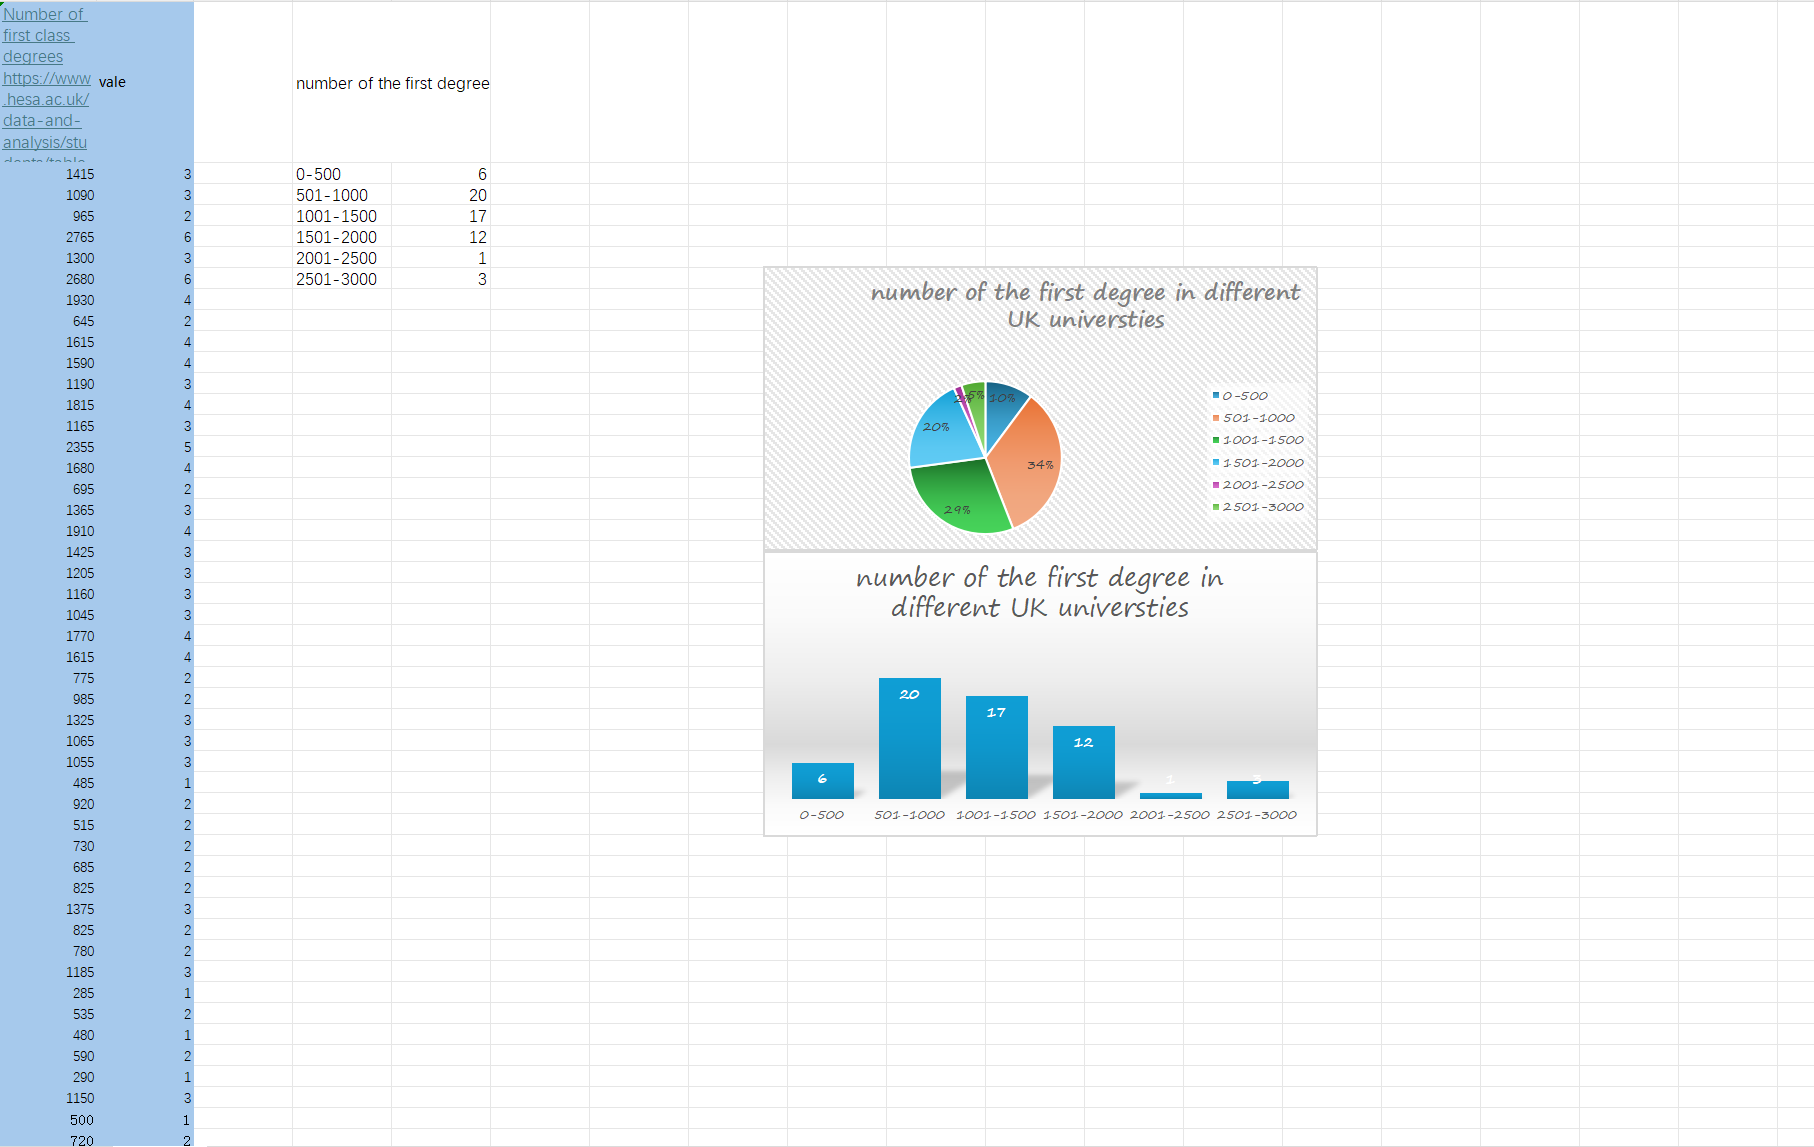
In a group task to present data in Excel, pie charts and bar graphs were produced. A screenshot of our group's visualisation is shown below. As highlighted by Kennedy and Hill, colour choice is important in visually communicating data. Although we were able to present the general trend of the data, the detail of the presentation and the colour scheme still appeared to be lacking in sophistication. Therefore changes were made to the colours to give the final result of the second image. In addition, Kennedy and Hill also pointed out that visualizations are enhanced by good annotation, I would analyse the background and context of the data in more depth, avoiding purely numerical presentations and adding more explanations and annotations, so that the audience can have a more comprehensive understanding of the meaning of the data.
I am more interested in data visualisation after reading a report in The Pudding, Cai et al. The effective use of data visualisation allows me to visualise the content and the images are eye-catching and impressive. Therefore, in my future study and practice, I would like to keep improving my skills in data visualisation, especially in visual representation and design, in order to better present the story behind the data to the audience.
 Discovering the Learning Process:
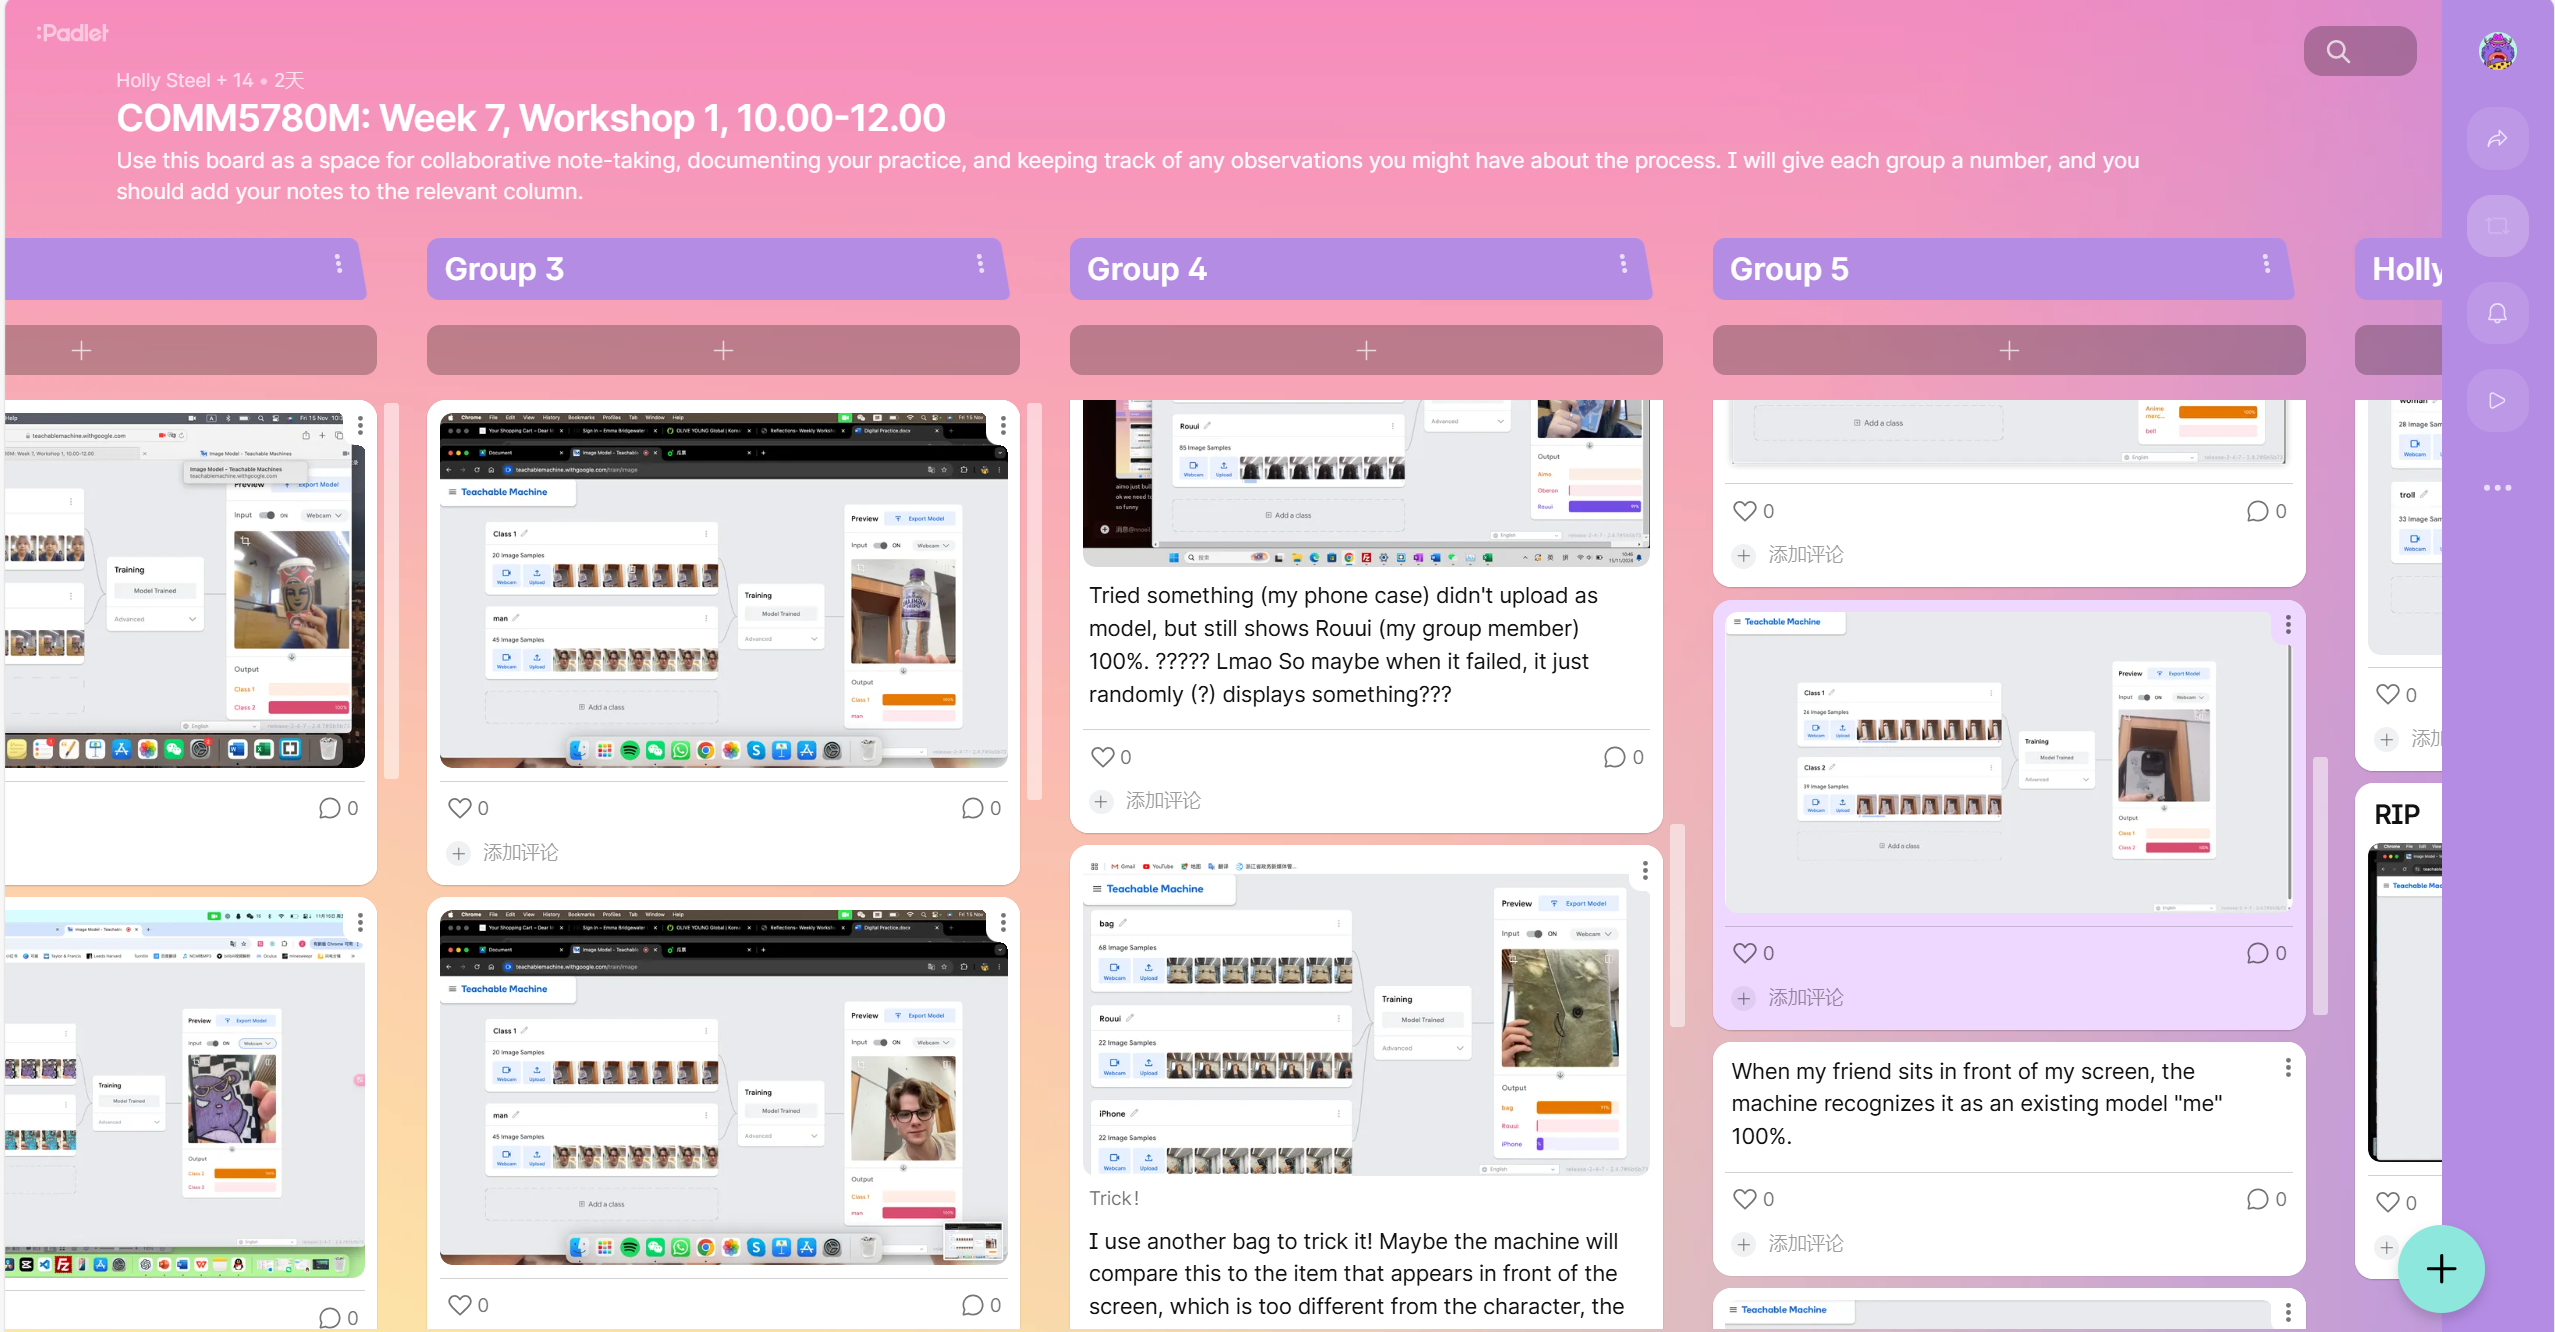
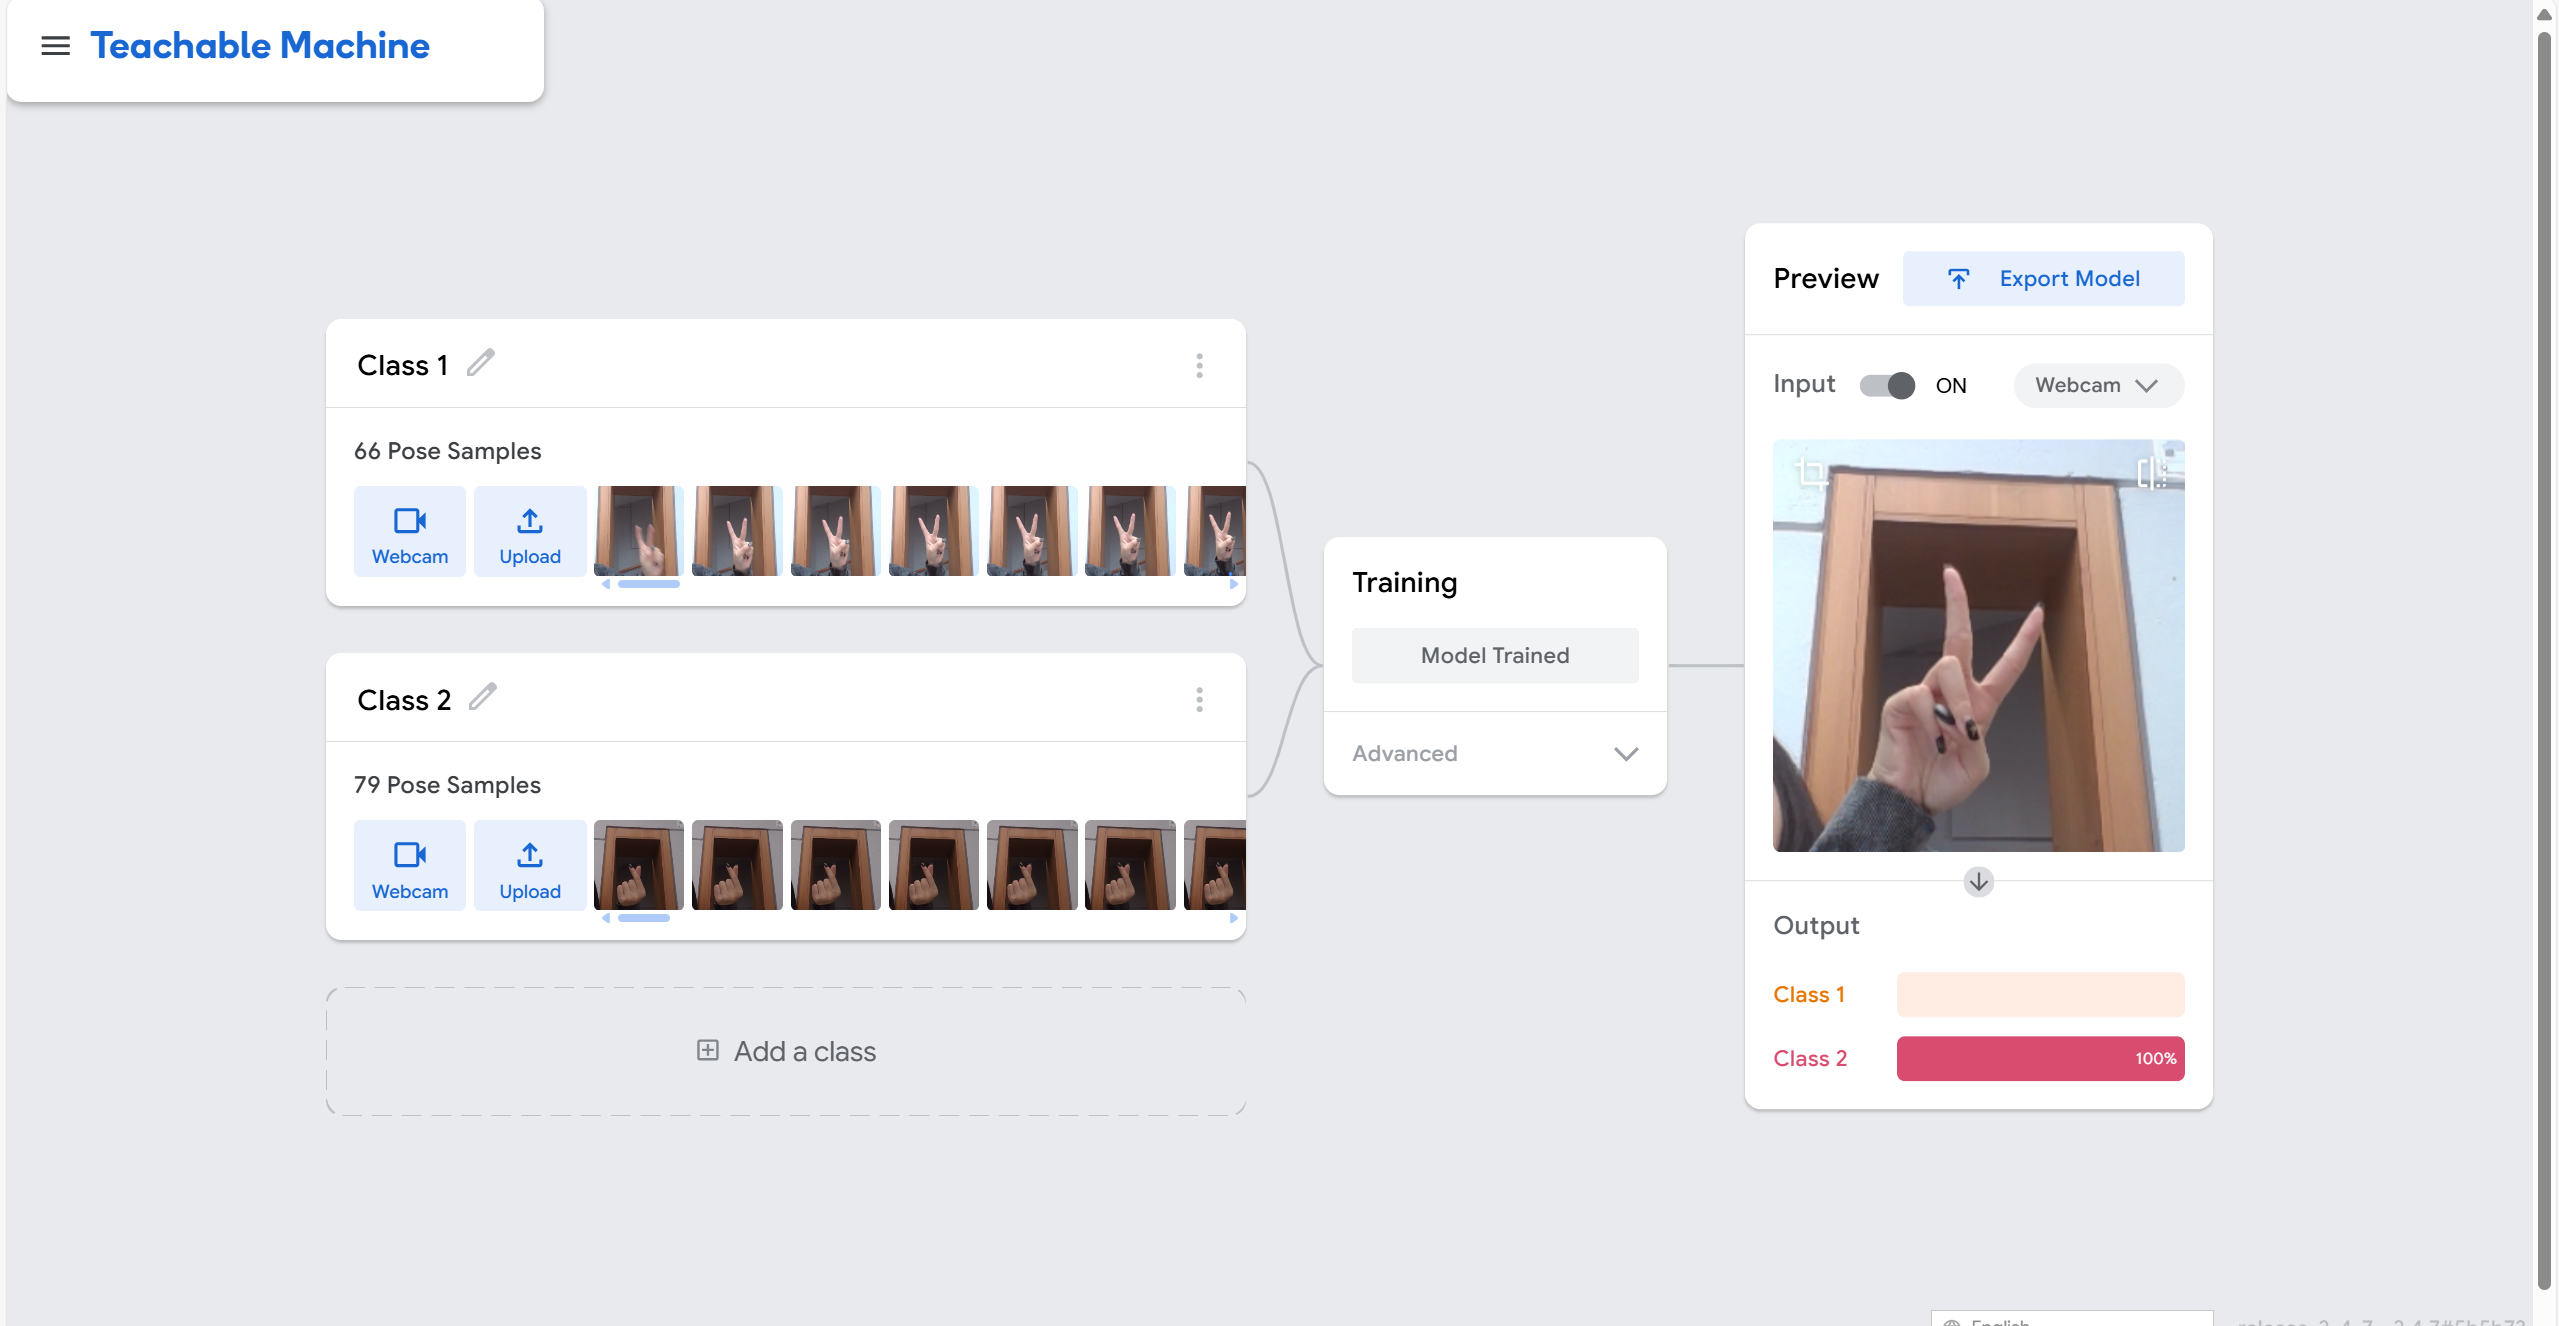
This lesson focuses on the Teachable Machine web tool, which allows users to create and train machine learning models through a simple interface. In the process, I experienced an intuitive and easy to understand machine learning process. Basically, simple items can be correctly identified and classified. However, to further understand its accuracy, the student sitting next to me invited me to perform the recognition with her, and we found that in cases of the same gender, the same skin colour, and the same hairstyle, the machine would misrecognise them. According to Scheuerman et al. it is emphasised that facial recognition technology is not neutral and reflects historically racialised gender binaries. The machine's training data and algorithms may be biased towards making more accurate recognition of some specific facial features. As a result, even when gender and skin colour are the same, facial recognition technology can still be wrong, demonstrating the problem of algorithmic bias and inaccuracy.
Similar to image recognition, the quality and diversity of sound data is crucial. Therefore, this process took place in my room after class, and I recorded several different environmental sounds: keyboard tapping, raining, and boiling water. However, factors such as recording distance and different microphones can affect the recognition results.
For the pose project, I chose scissor hands and hand gestures meant to compare hearts. During training, I found that the shooting background could be misclassified as other gestures. For example, when I raise my other hand for the scissor hand gesture, he will cause the result to be wrong due to recognising a similar background. This made me realise that training a model that can over recognize accurately in different environments and ensuring that the data is comprehensive and diverse is key.
Learning Process Reflection:
These techniques are also used in everyday life. Siri, for example, relies on similar voice recognition techniques to respond to user commands. If the recognition accuracy of these systems is not high, it may lead to a poor user experience and may even result in misuse. In addition, the widespread use of voice recognition systems raises privacy and surveillance issues, especially when these technologies record and analyse without the user's explicit consent. In furniture-only, controlling devices through gestures can provide a more natural interaction. However, the accuracy of gestures is also an area that deserves to be strengthened to avoid the problem of poor experience due to misuse.
Scheuerman et al. also point out the unequal impact of facial recognition technology in surveillance. Facial recognition through my classmates and me shows that this not only exposes the flaws of the technology itself, but also reflects that the widespread use of this technology may bring about the violation of individual identity and privacy. Thus, automatic essentialisation allows these technologies to ‘essentialise’ people's identities when automatically classifying them, resulting in the identification of groups of people being reduced to ‘fixed essentials’ while ignoring the fluidity and diversity of their identities.
The following pictures are screenshots viewing the process of applying the Teachable Machine:
Discovering the Learning Process:
This week's workshop explored how data affects our perception of ourselves and others. During the learning process, I reflected on the following key aspects:
According to Cheney-Lippold (2017) notes that "algorithmic identity" is not a reflection of our true identity, but an inference made by the algorithm based on data. These data come from our daily browsing history, social media interactions, shopping history and even geographic location data, which will be collected by the platform and used to build our digital identity. In this process, I realized that this data is used to build our digital identity and prepare for the subsequent provision of personalized services and content to each user.
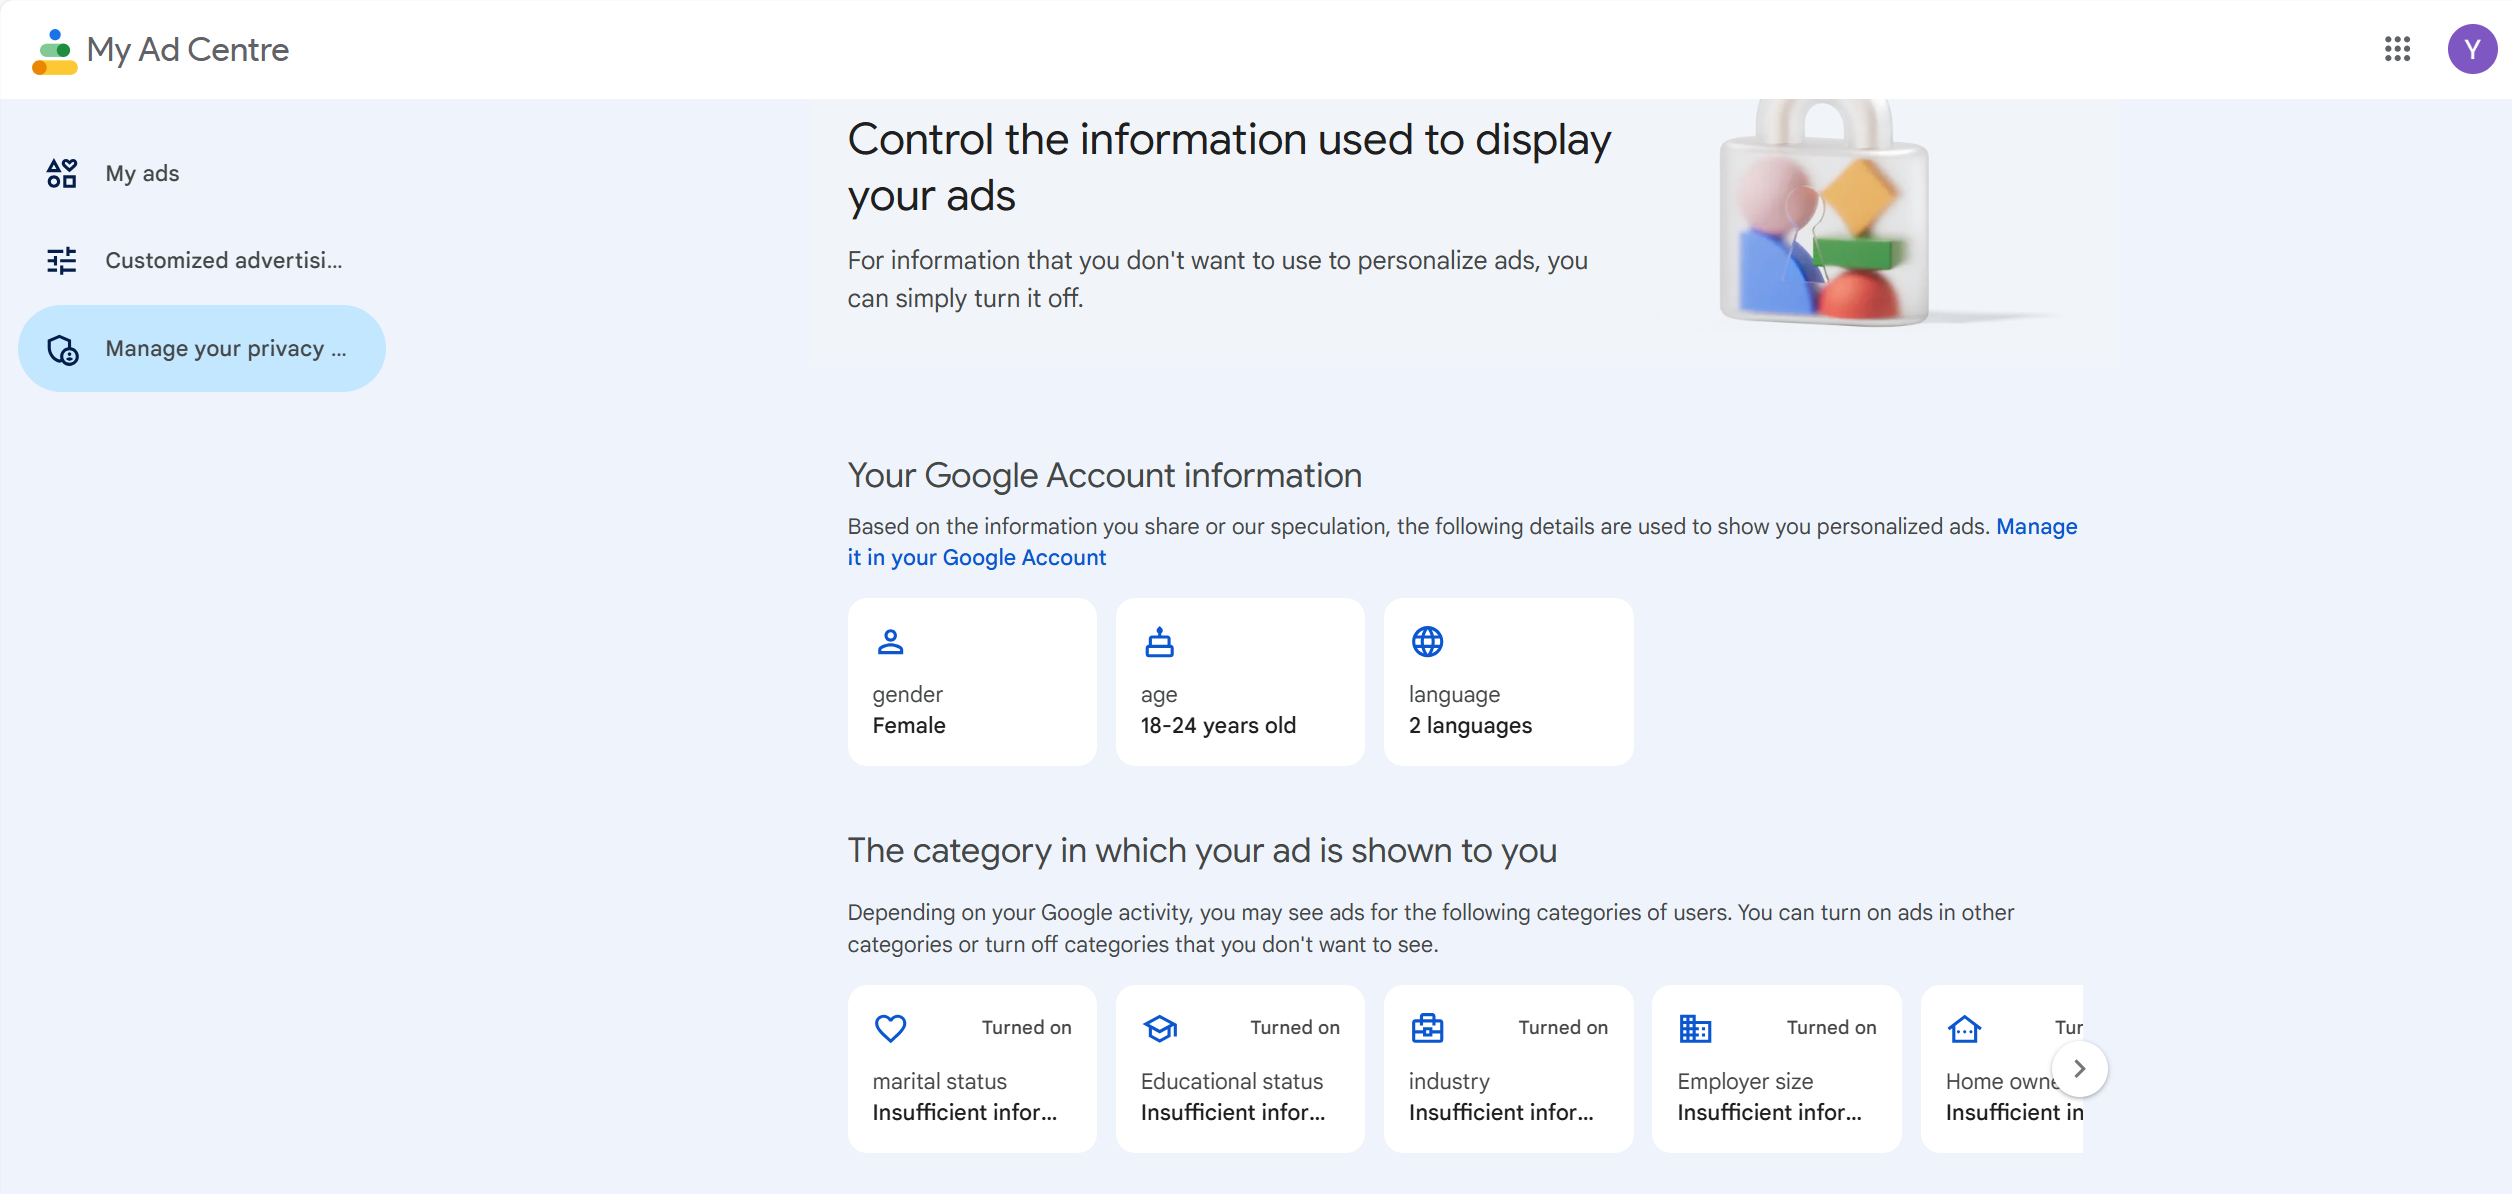
The output data reflects the platform's understanding of users. For example, I checked my Google ad profile to understand what data Google uses to decide which ads to push to us. This process revealed how the platform classifies us based on our search history, website visit records, and other activities. It also made me realize that although search engines bring us convenience, they invisibly limit users' power to obtain diverse information. At the same time, this made me reflect on whether I am too dependent on search results. In class, Holly also emphasized the importance of critical thinking. When using media, one can deliberately change behavioral data. Perhaps in the future, I will consider searching or watching more different content to avoid the control of algorithms.
Process Challenges:
A significant challenge was the protection of data privacy. While data collection can facilitate the delivery of personalized services, it also gives rise to concerns about data protection and ethical standards, particularly given the lack of awareness and control individuals have over how their data is collected and used. As previously discussed in relation to search engines, this presents an ethical dilemma between the benefits of convenience and the need to protect privacy. Secondly, the algorithmically constructed 'identity' is compared to my true self-perception.
According to Sumpter (2018) notes, there needs to be more consistency between the nuances of my personality and situation and how they are reflected in algorithms. This indicates that algorithms are primarily designed to categorize users into broad groups rather than to fully comprehend their individual nuances. The influence of commercial and institutional interests on data is primarily for marketing purposes. These challenges underscore the necessity of algorithmic transparency and accountability to guarantee that data-driven systems do not exacerbate misinformation or unfairness.
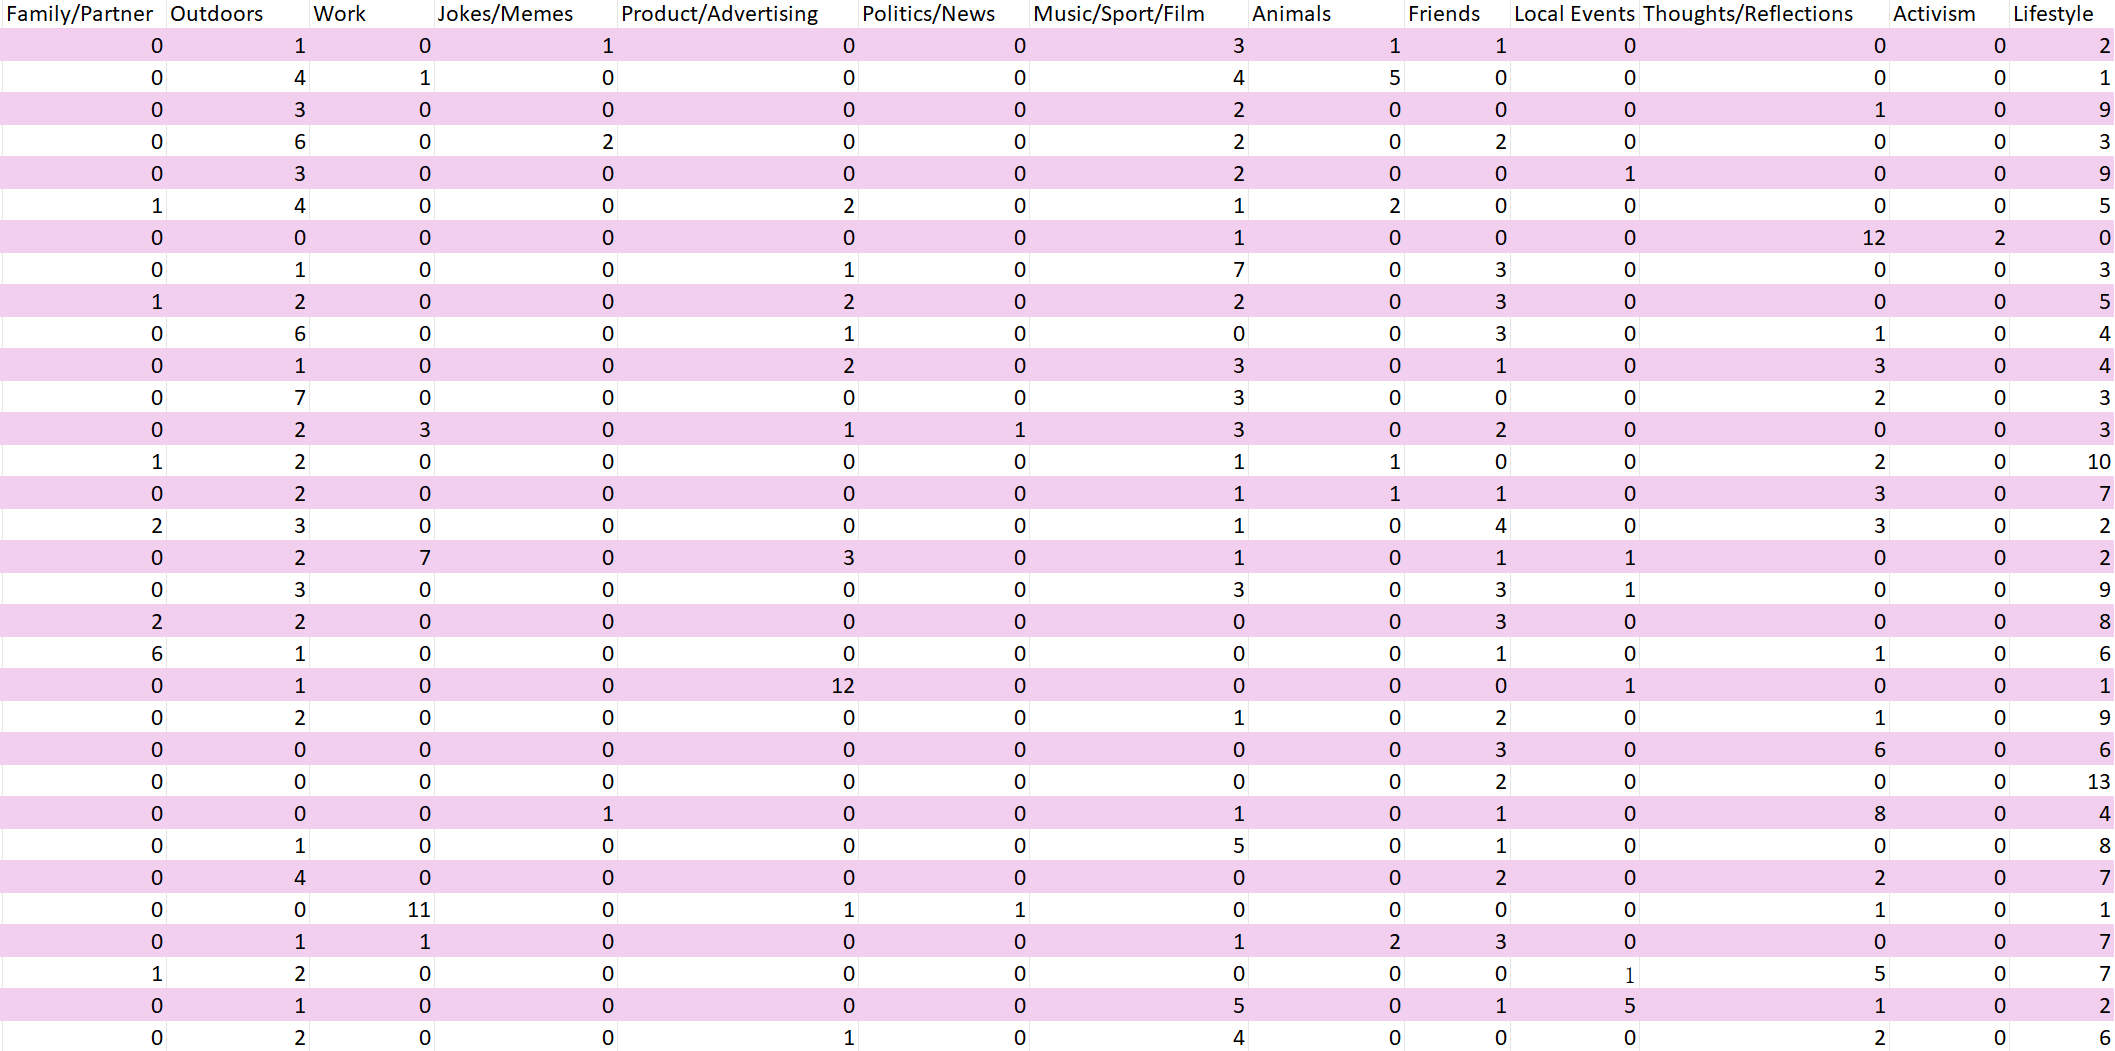
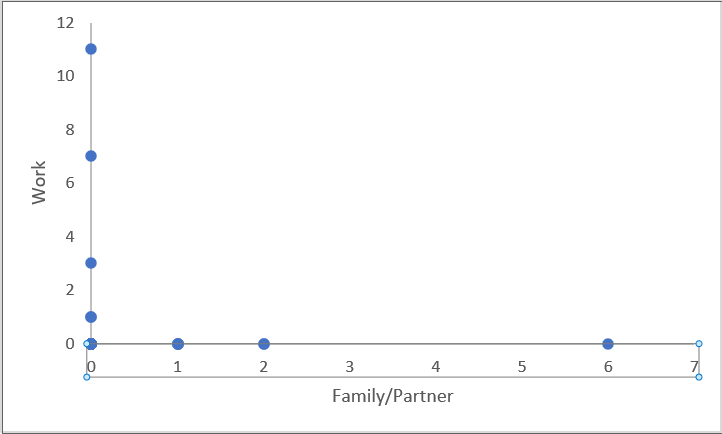
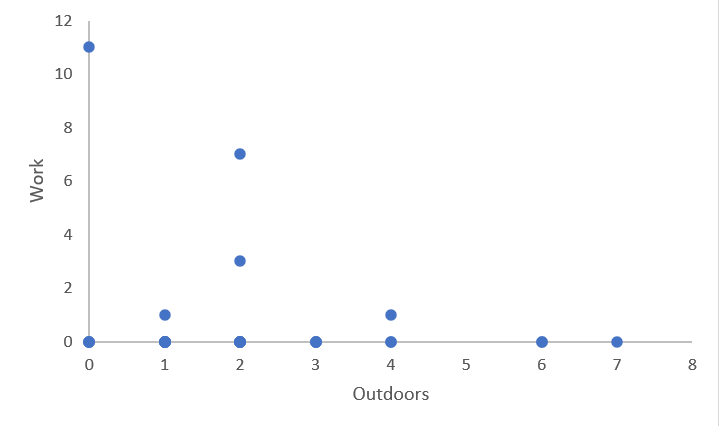
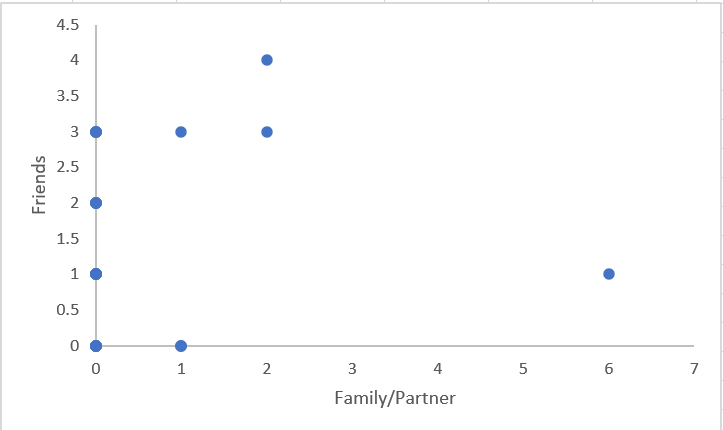
Finally, the categorization of 32 friends' social media posts across 15 categories is consistent with Sumpter's (2018) simplified approach to categorizing friends. However, the data set is incomplete as it only captures the most recent 25 posts, which fails to account for the full complexity of the situation and does not provide a comprehensive representation of the individual in question.
The following pictures are screenshots viewing the OUTPUT and PROCESS learning process:
Discovering the Learning Process:
Pink et al. (2016) define a social world as a relatively limited, but not completely closed, domain of social life. These social worlds redefine interpersonal interactions and identity construction through digital platforms. In the workshop, I also experienced this approach first-hand, in particular how to study the online identities of social media data friends through Stumpter's method.
It is pointed out that the concept of the ‘social world’ refers to the interactive behaviour of people in their everyday lives and generates specific meanings (Pink et al., 2016). It emphasises the diversity of society. Through this framework, I understand how people communicate and interact in different social settings. This is also reflected in Sumpter's approach 13 categorisation. However, in the process of categorising my friends' social media posts, I realised that dynamic analysis is extremely important for constructing digital identities. We should treat the social world as a dynamically changing domain (Pink et al., 2016). At the same time, I learnt that this experimental process can be considered a small-scale digital ethnography. Unlike general ethnographic methods, it relies on the characteristics of online interactions and social media platforms, so the researcher needs to take into account the platform's algorithms, privacy settings, the dynamics of the users, as well as the right to know of the users under investigation (Tiidenberg (2018). In Task 2, when I chose an online community to ethnograph, we similarly needed to consider how the community members' could be observed and analysed without violating privacy.
Process Challenges:
In actually collecting and categorising the data, I found it difficult to categorise the types of posts. In other words, due to the dynamics of social media platforms' algorithms and user behaviours, we were only able to obtain a numerical representation of the last 15 posts about a friend or community member, which may not be entirely consistent with their actual life experiences. Often times, these posts tend to be carefully selected or filtered and do not fully reflect who they really are. Therefore, I believe that balancing the gap between ‘digital identity’ and ‘real identity’ is an important challenge in digital ethnography research. In addition, for Task 2, when I search for a specific community on social media, the recommendation mechanism of the platform will dynamically adjust the push content according to the posts that I clicked a lot, which may result in that I may not be able to see the comprehensive and diversified types of posts in the community, but rather be guided to some specific directions.
In conclusion, by combining the literature with practical exercises, I have gained a deeper understanding of the application of digital ethnography and the related ethical issues. Digital ethnography provides a unique opportunity for researchers to delve into people's behaviour and identity construction on social media. Finally, the following 3 graphics were created by me through a comparison of post types:
Discovering the Learning Process:
The mini-games on Twine in this Workshop helped me to explore what interactive narrative is and fully understand the process of interactive narrative. As Aarseth (1997) highlights 'cybertext' as an automatically organized form of text, the structure and interactivity of the medium play a central role in the narrative experience, capable of automatically generating diverse forms of expression through reader input. This was deeply experienced in my event. I first chose WHO STEALED THE BONES to gain an understanding of the game's story. The story was designed to allow us to appreciate how interactivity can spark curiosity or humour, which in turn creates a personalized experience. Subsequently, when I made a second attempt at the game, I realized that clicking on different options resulted in different storylines. Thus, unlike traditional narrative storytelling, interactive narratives utilize a non-linear structure that allows the reader to influence the progression of the story through choices (ibid).
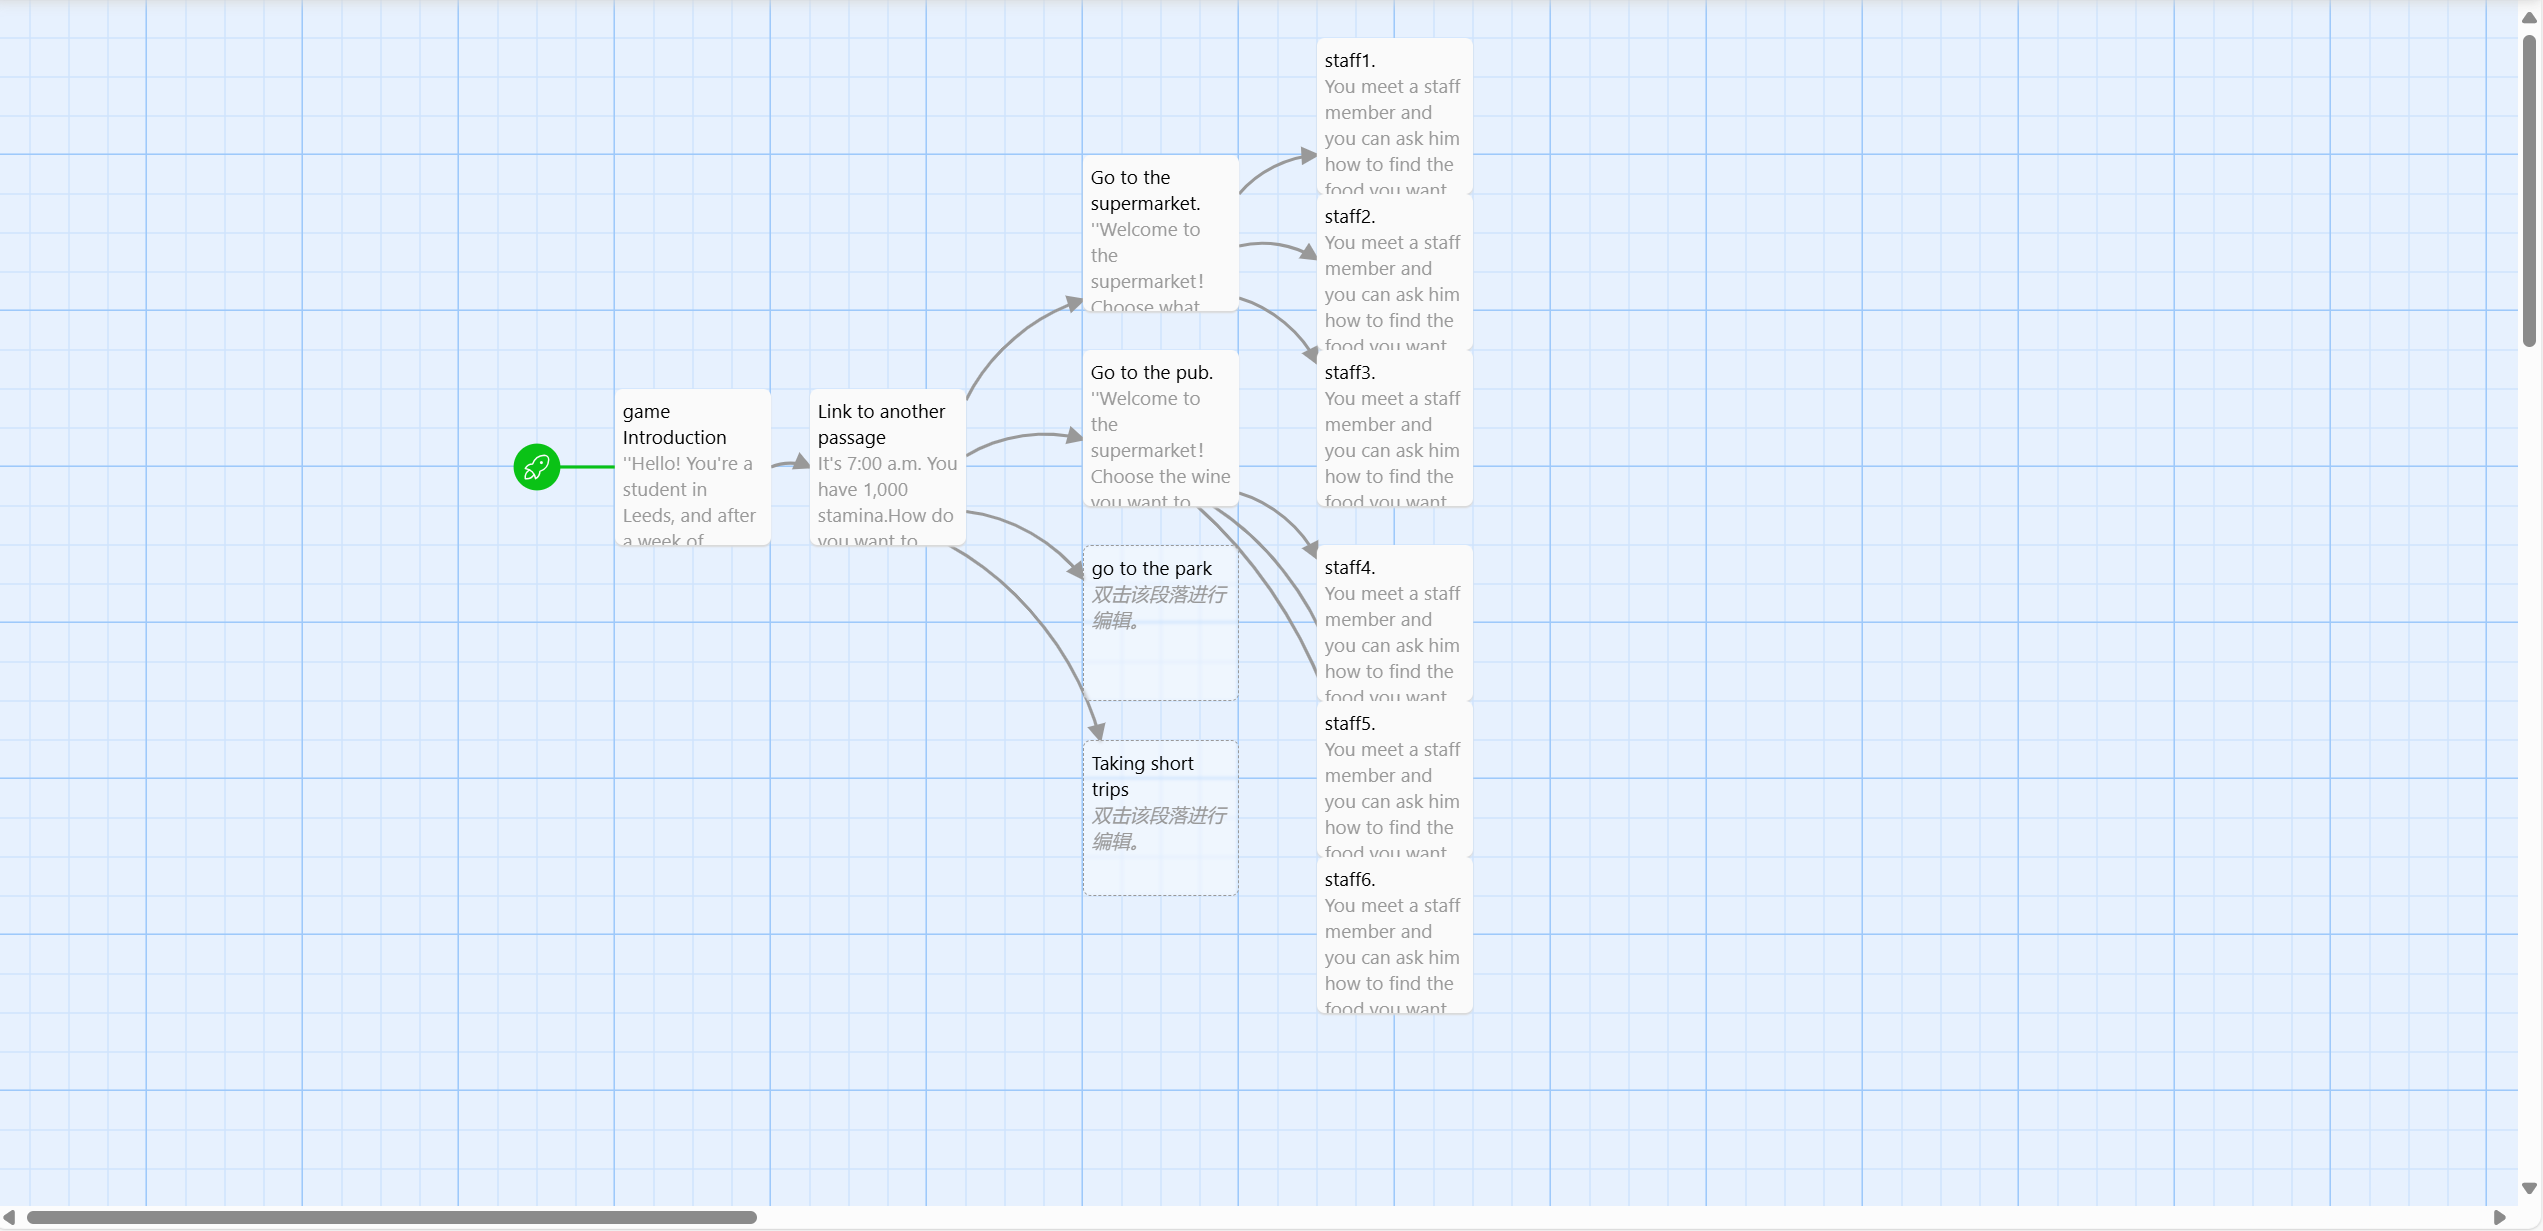
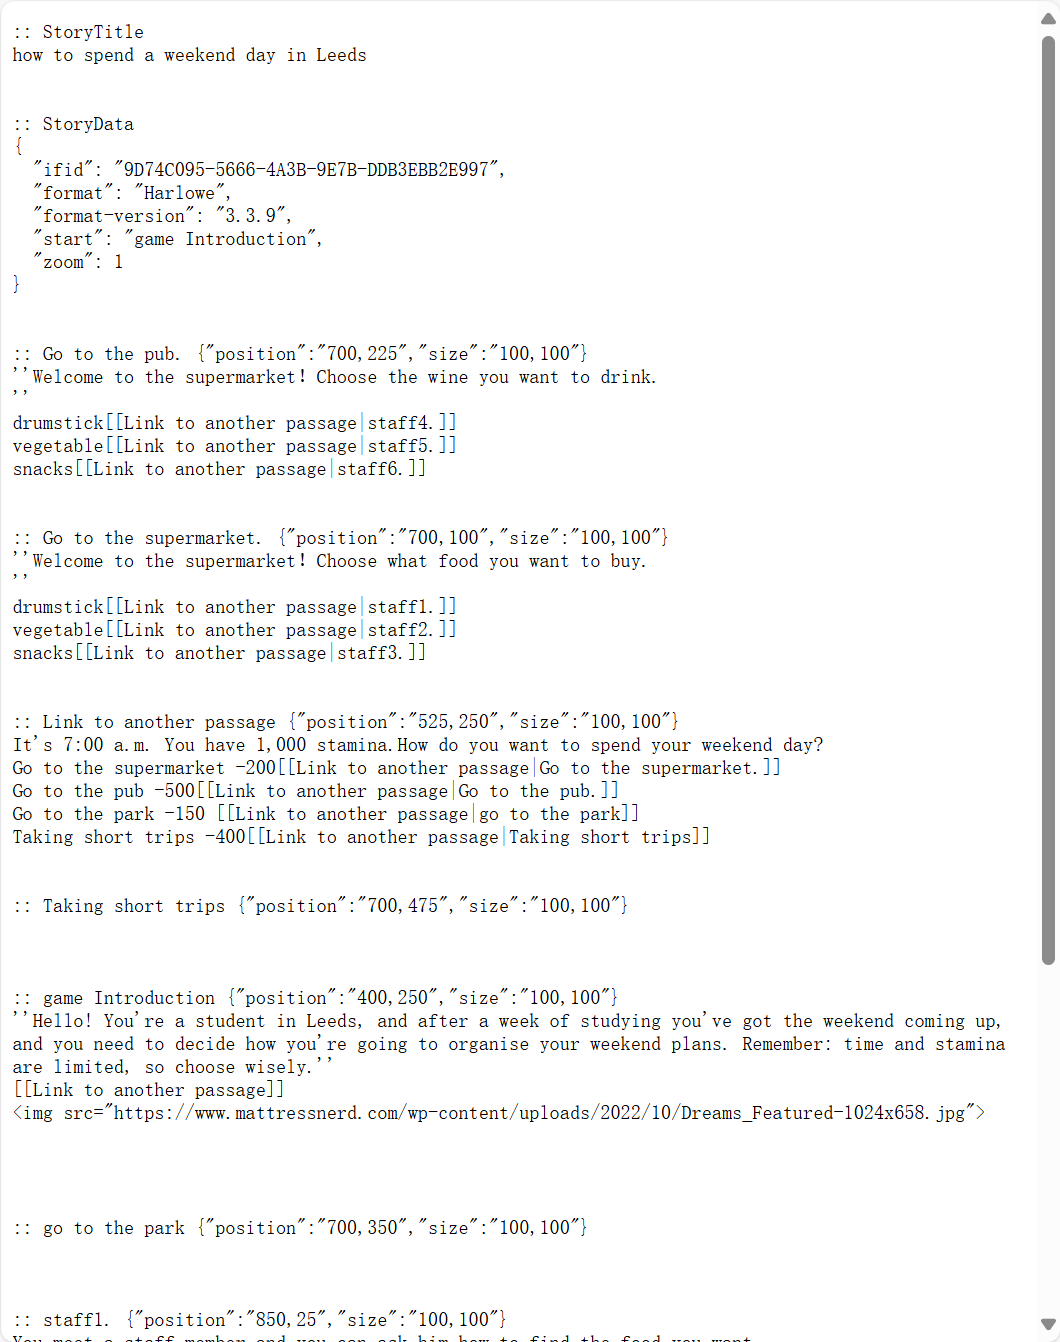
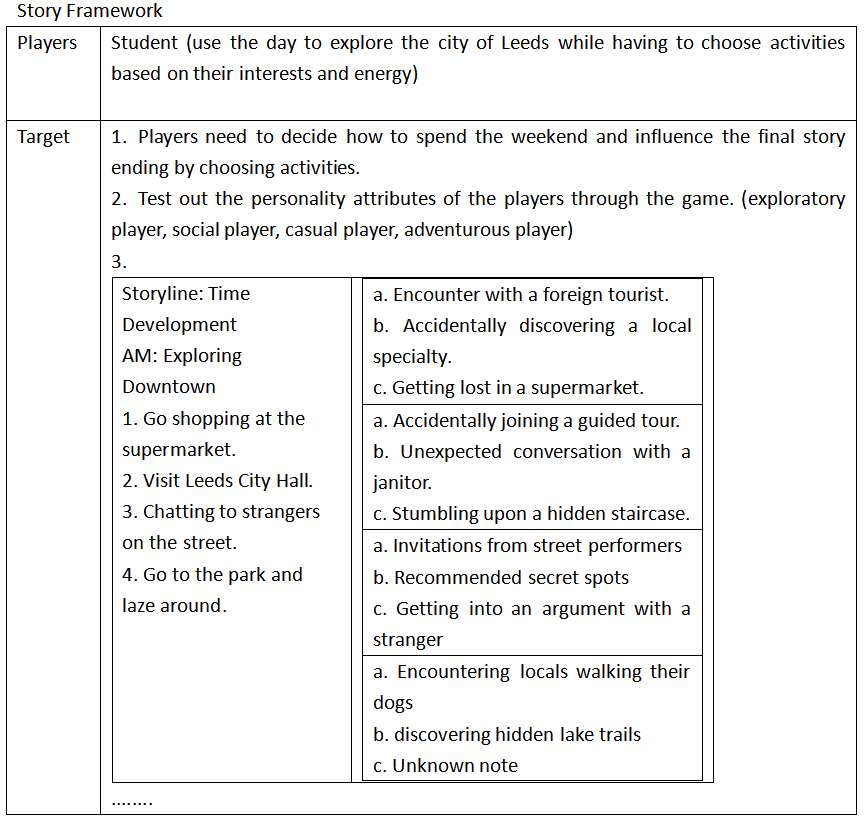
Based on these insights, our group created our own interactive story, 'How to spend a weekend day in Leeds.' It was inspired by student life at the University of Leeds. We designed the story to include text and images to enhance immersion. During the production process, we learned how to add links and manipulate Twine using Harlowe formatting. By planning the narrative structure with a decision tree, we ensured that the logic of the story flowed smoothly, while incorporating meaningful choices to enrich the reader's experience.
Process Challenges:
We had a clear division of labor when creating the interactive narrative, and I was mainly responsible for getting the images. Being unfamiliar with the Twine process, there were a number of challenges. Finding a balance between complexity and clarity was a major dilemma. While we wanted to offer a variety of choices, too many options could confuse readers, and too few options could diminish engagement. Designing meaningful choices was equally challenging, and we needed to ensure that each decision had a significant but reasonable impact on the narrative. There were also some initial technical difficulties in integrating multimedia (such as images and fonts), but we realized the importance of these elements in enhancing visual appeal. Finally, there was a need to ensure smooth collaboration and ongoing testing with members while maintaining a consistent tone for the different narrative branches.
Due to time constraints, the story was only beginning, not finished. Below is a screenshot of our classroom documentation of the story-making process:
Discovering the Learning Process:
This week's discussion revolves around the concept of ‘datamining’. Looking back at the previous week's Special Collections' approach to historical data collection, I realised how data in historical societies are recorded and related to the present, as a tool for objective recording, as a vehicle for power relations and as a constructor of social narratives. The process of transforming social, cultural and economic activities into data that can be stored, analysed and applied makes it an important tool for understanding the world and for decision making (Koenen et al., 2021).
1. Instrumental rationality and the obscuring of power in datafication
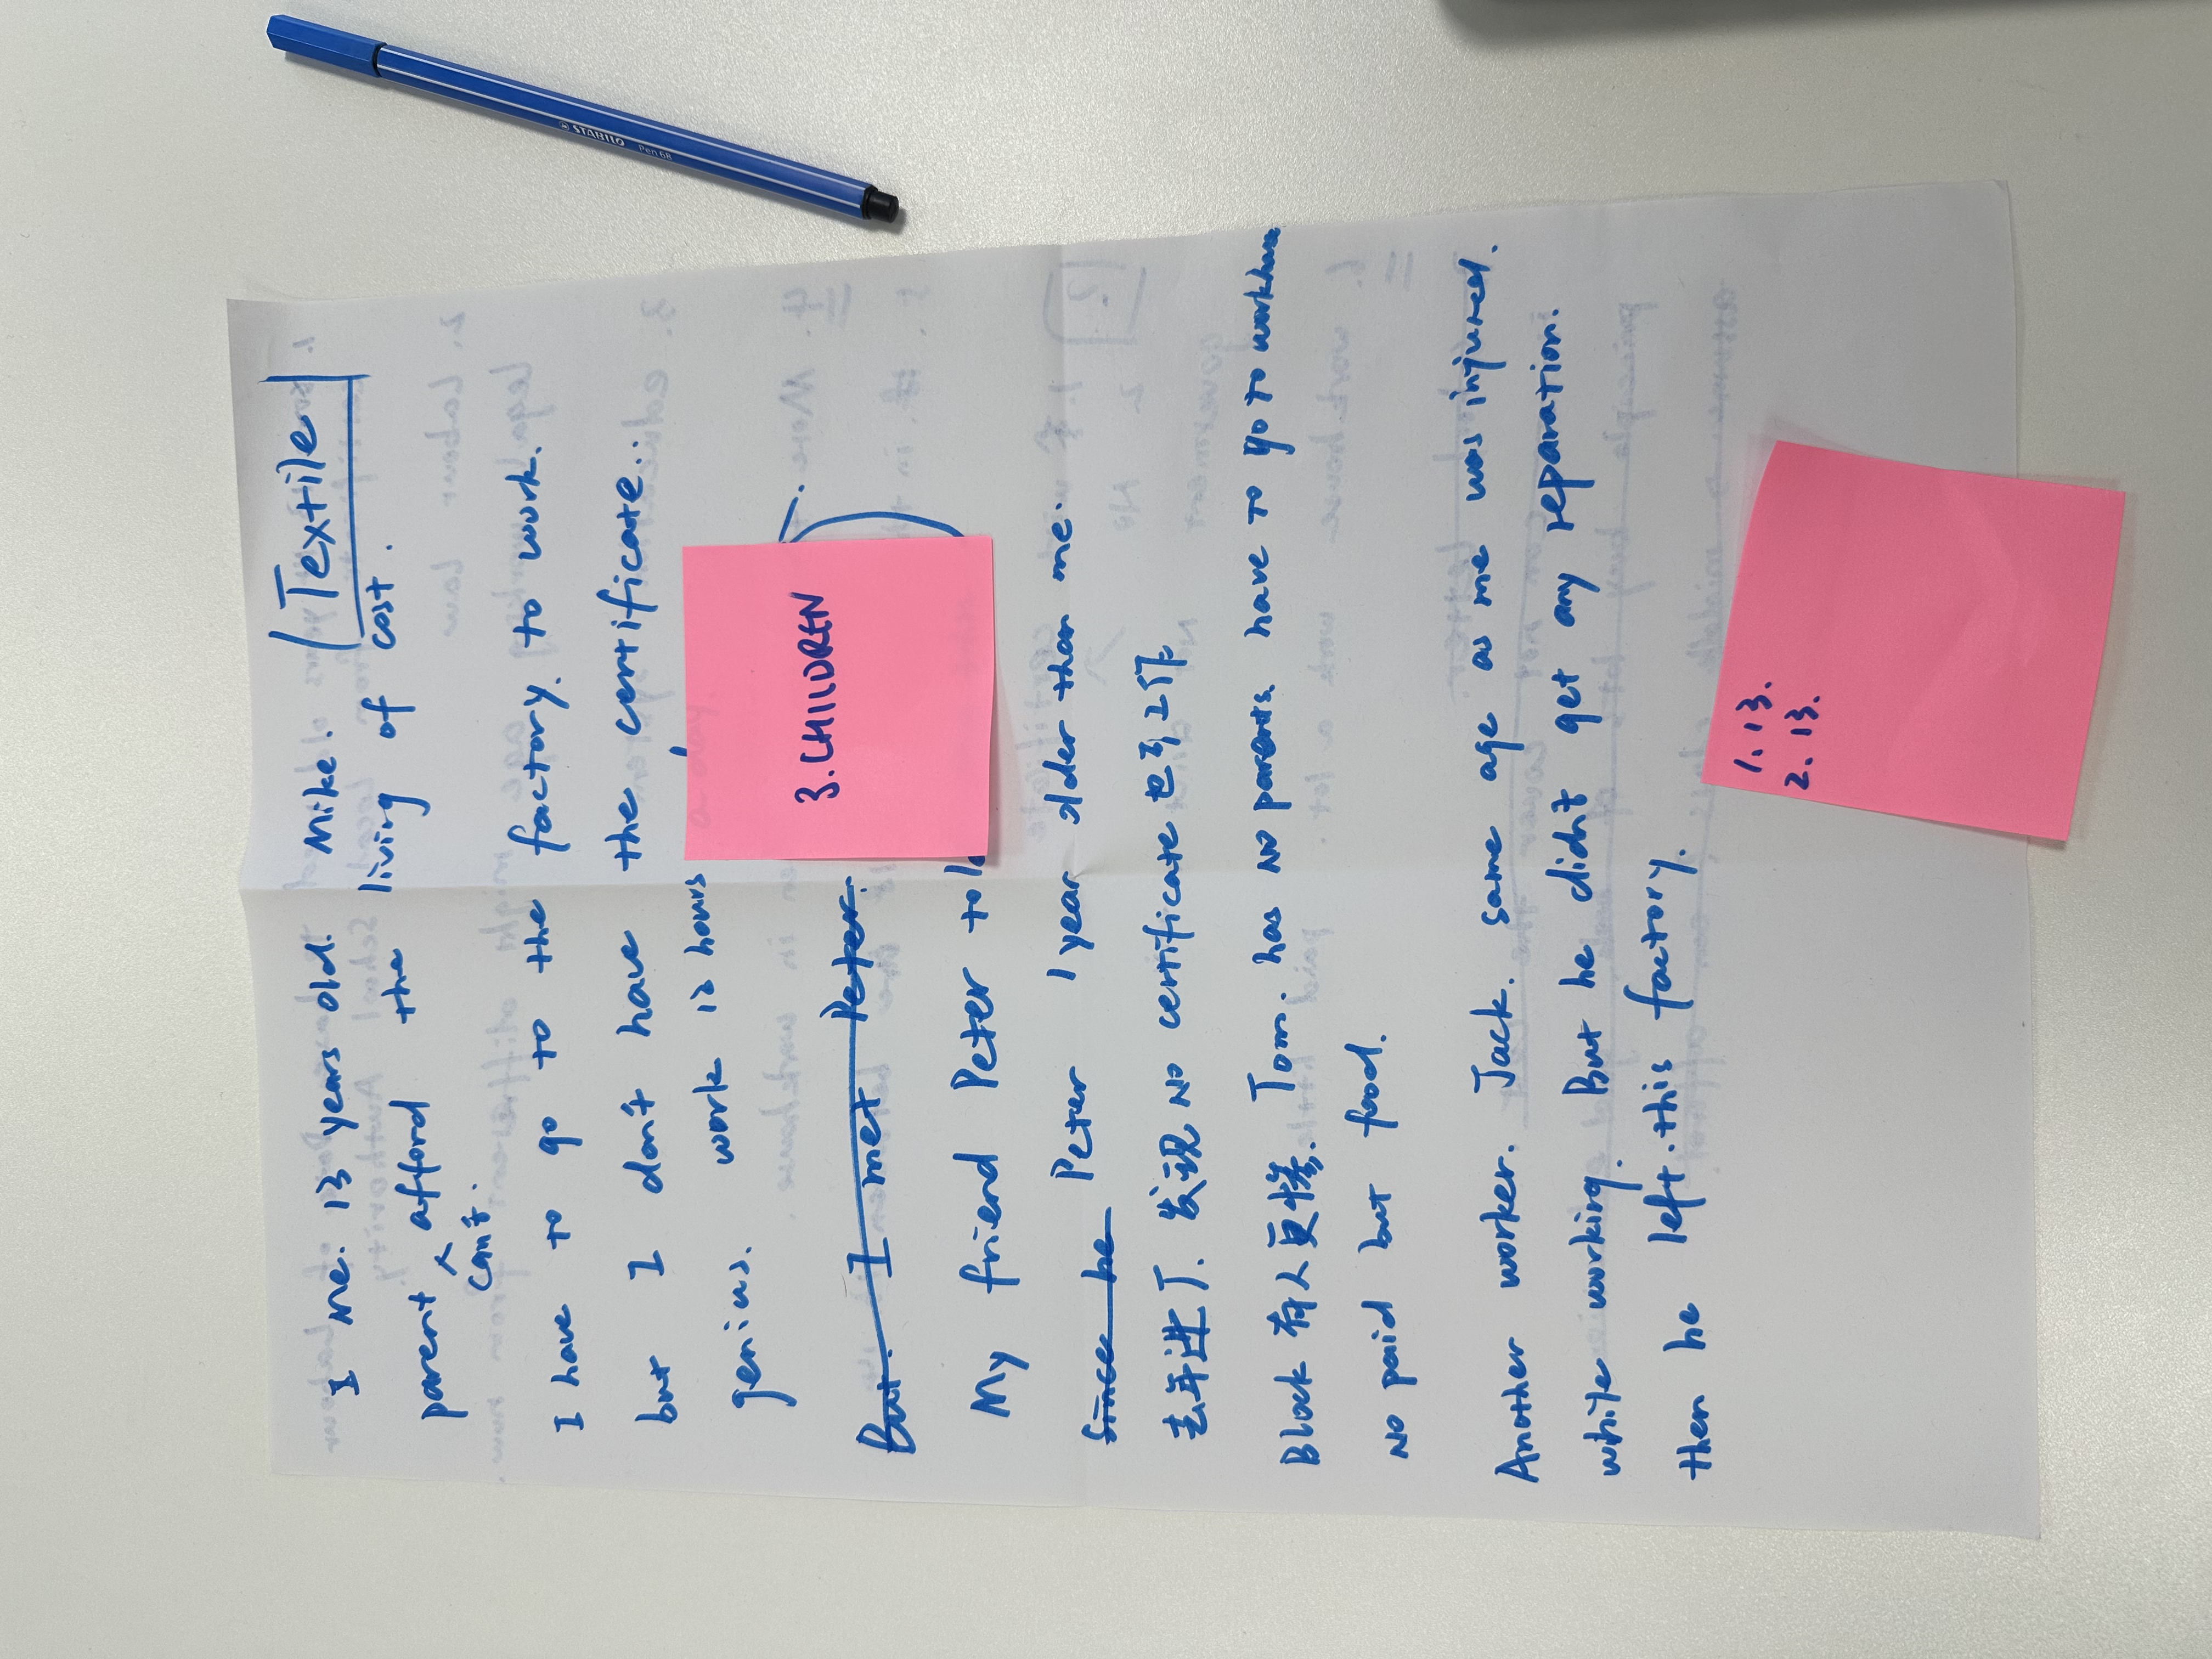
In reconstructing the virtual story of Thomas, a 19th century child labourer, the historical dimension of datafication proposed by Koenen et al. (2021) is concretely evidenced. The seeming neutrality of ‘standardised data’ such as factory lists and pay slips implies the logic of capital's objectification of labour: children are reduced to units of productivity, such as ‘12 hours of labour per day’, while their emotional needs and right to grow are erased. This selective recording echoes the flattening of user profiles in current algorithmic recommender systems across time and space, where there is no doubt that datamining always serves the cognitive framework of a particular subject.
Upon reading the LGBTQ+ Collection Guide, we find that it sheds light on issues of bias and power distribution in historical data collection. Data categorisation is not as neutral as it seems. For example, in the past, archival systems defaulted to heteronormative standards, and the life experiences of cool kids were only hidden in categories such as ‘family letters’ or ‘medical records,’ which is like shoving child labour issues into a category where they don't belong. It is worth thinking about how this kind of categorisation is actually a way of mainstreaming people's decisions about which stories are worth documenting, and which ones should be hidden, which is essentially a question of who has the power to define history.
2. From Critical Deconstruction to Multiple Narrative Reconstruction
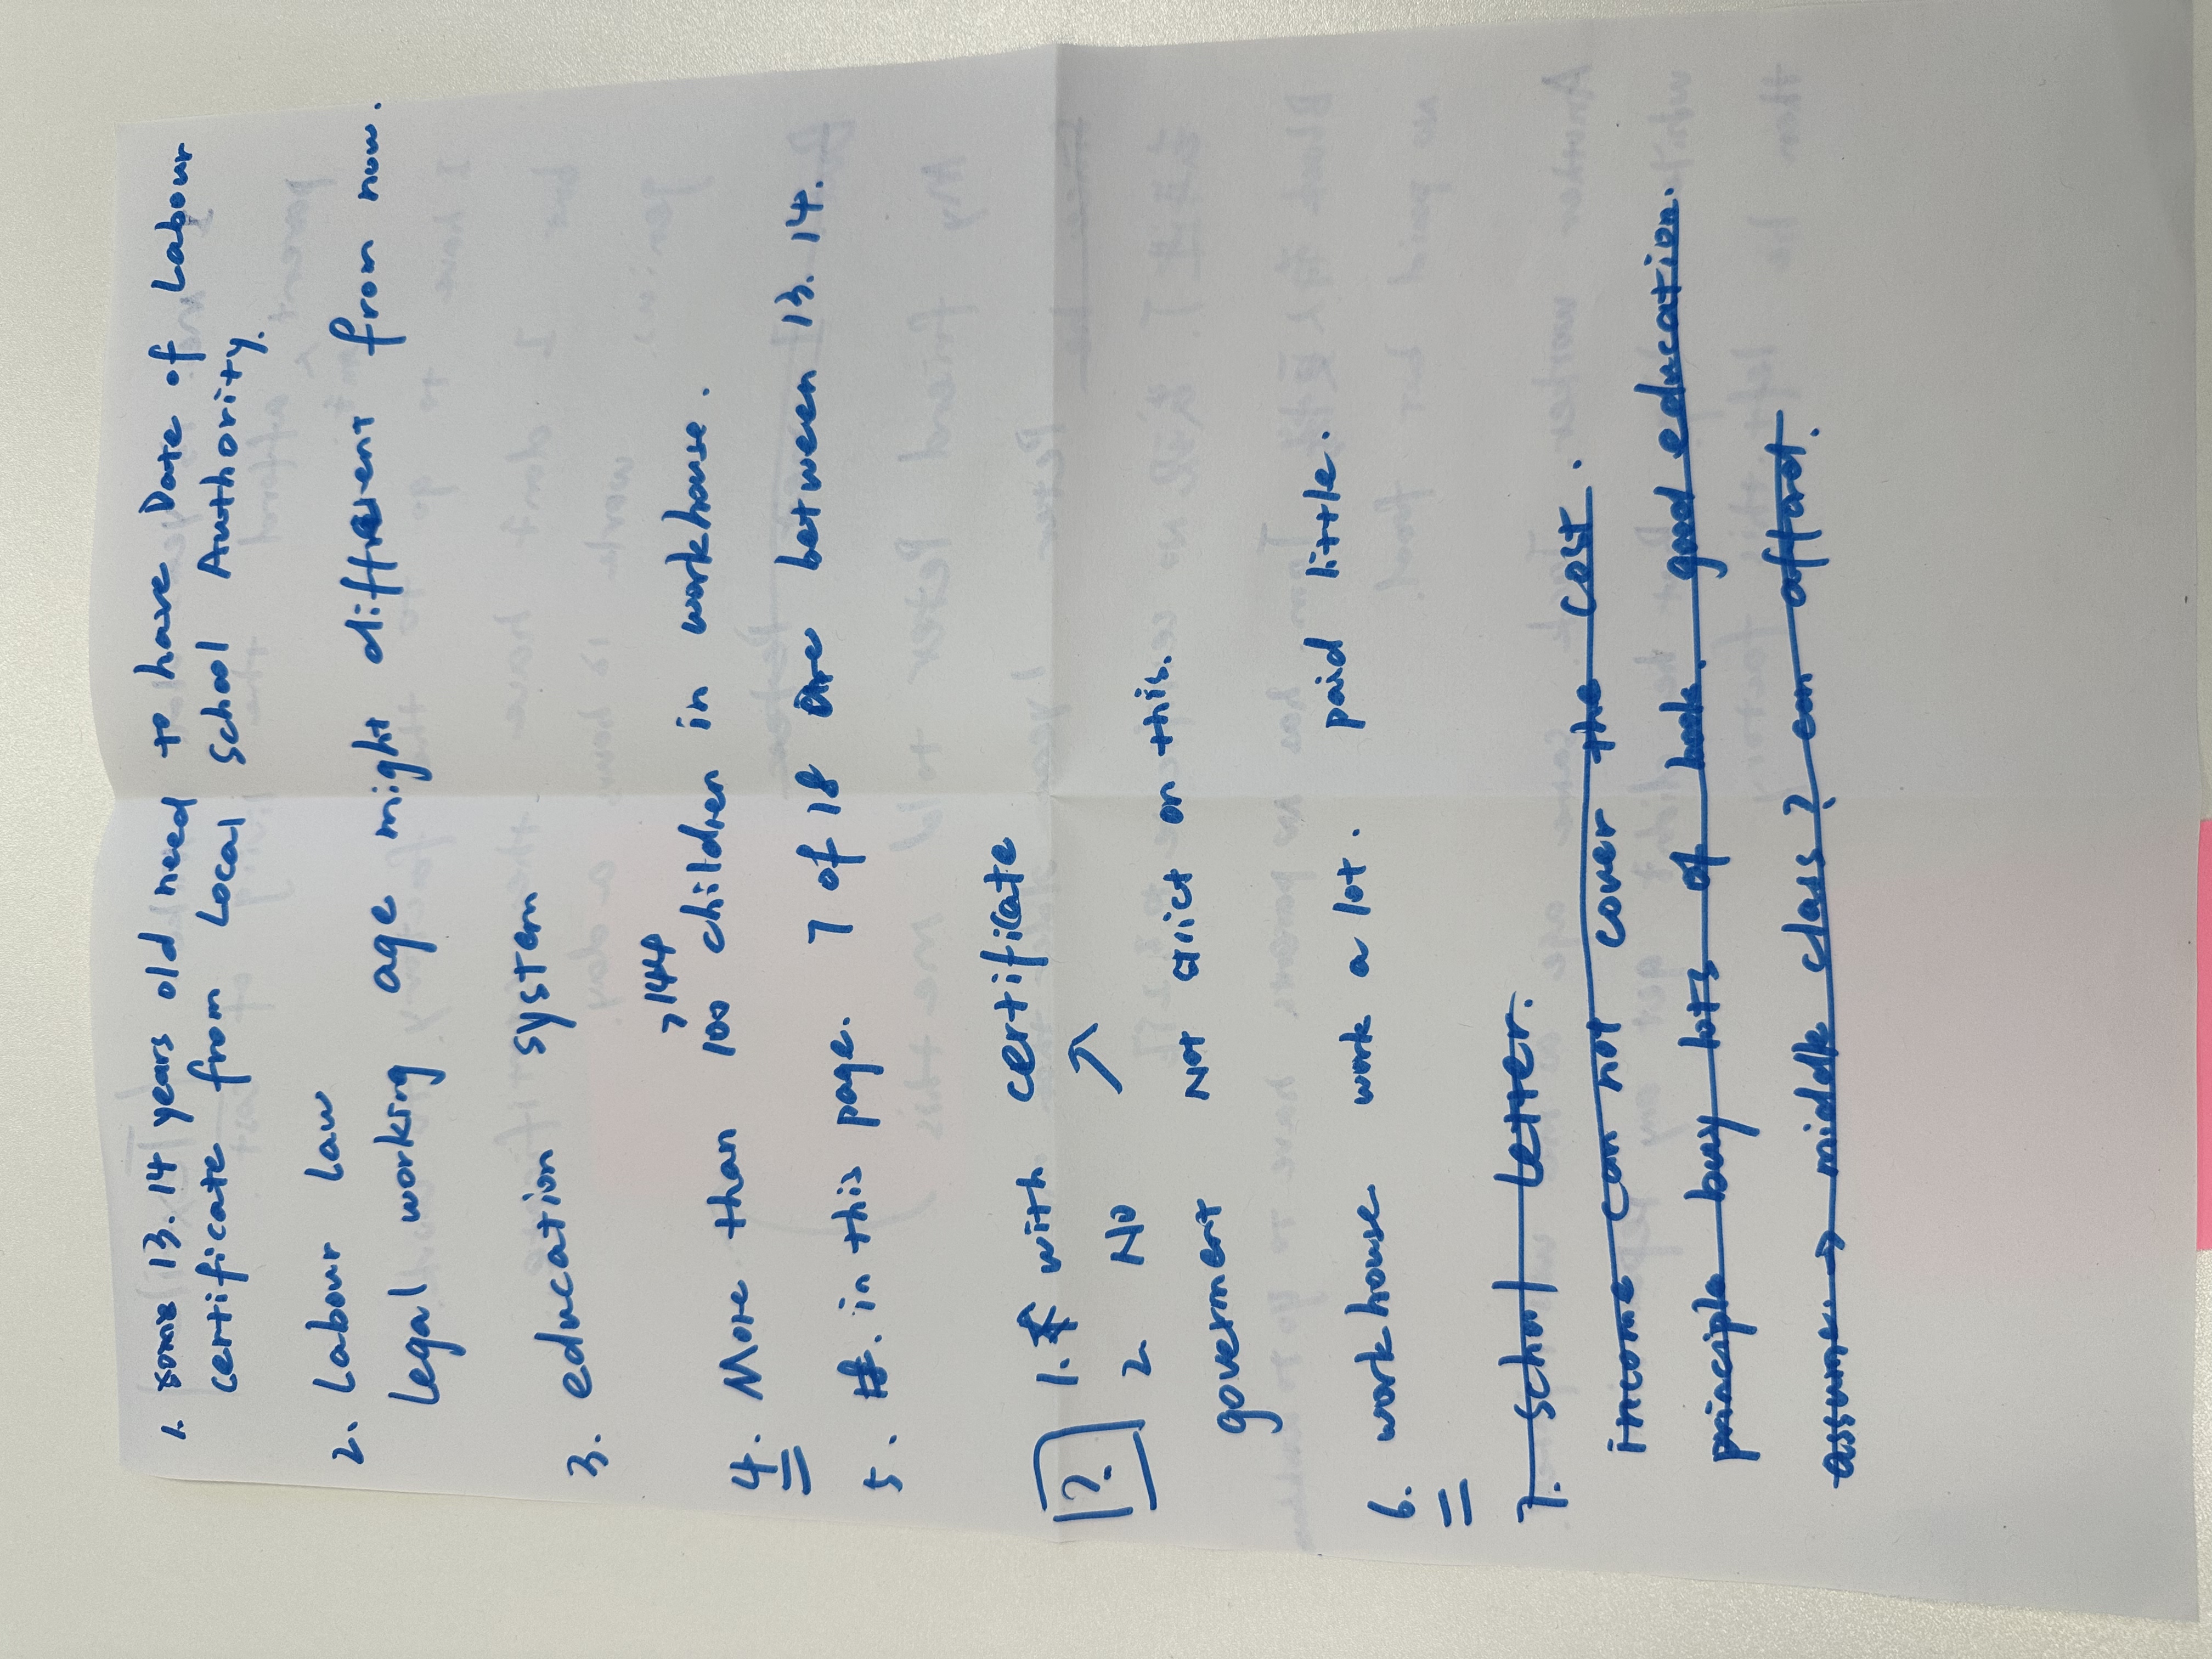
Through the learning in the workshop, my group discussed the historical data of children in the 19th century, especially the archives related to child labour. For example, lists of child workers in factories, records of wages and hours worked. From the data we found that children aged between 13-14 years old were required to have a labour certificate issued by the local school board. Despite this, there are still child workers without labour certificates. We speculate that the labour laws were different or imperfect. As we use the data as a basis for speculating about the children's lives, and include an examination of the social context of the 19th century, it is worth reflecting on the narrative ethical dilemma we inevitably face as we use the data to construct Thomas's story: while virtualisation can enhance historical empathy, it can blur the boundaries between the real and the fictional through the literary imagination. This prompts me to reflect on the risk of ‘visual romanticism’ common in digital humanities - is the sensual packaging of data dissolving the structural oppression behind it?
It is also worth reflecting on the narrative ethical dilemma we inevitably face when we use stories constructed from data: while virtualisation enhances historical empathy, it can blur the boundaries between the real and the fictional through the literary imagination. This prompts me to reflect on the risk of ‘visual romanticism’ that is common in digital humanities: is the sensual packaging of data dissolving the structural oppression behind it?
Reflection-From History to the Present
This study is a mirror image of my understanding of contemporary social issues. While in the 19th century factory owners covered up exploitation through selective recording of wage data, the modern platform economy is glorifying labour alienation through ‘reports on the efficiency of the casual economy’; while the systematic bias of historical archives has led to the aphasia of the LGBTQ+ community, current algorithmic recommender systems are exacerbating social cognitive cleavages through the use of data filtering bubbles. This requires us to always be vigilant when using data tools: every data collection is a tailoring of reality, and every set of analytical models carries a value judgement.
Below are the working notes from the WORKSHOP:
Discovering the Learning Process:
In this workshop, we explored the partiality of historical data, as discussed in "Data Feminism" by D’Ignazio and Klein, and how our standpoint shapes the interpretation and presentation of this information.
A significant part of the workshop involved using Optical Character Recognition (OCR) tools such as OCR Space and Adobe Scan to digitize text from non-digital sources. While these tools are useful in making historical documents more accessible, their limitations became evident—especially when dealing with handwritten or low-quality printed texts. The process highlighted the importance of accuracy and context when working with historical data, as misinterpretations can lead to misinformation.
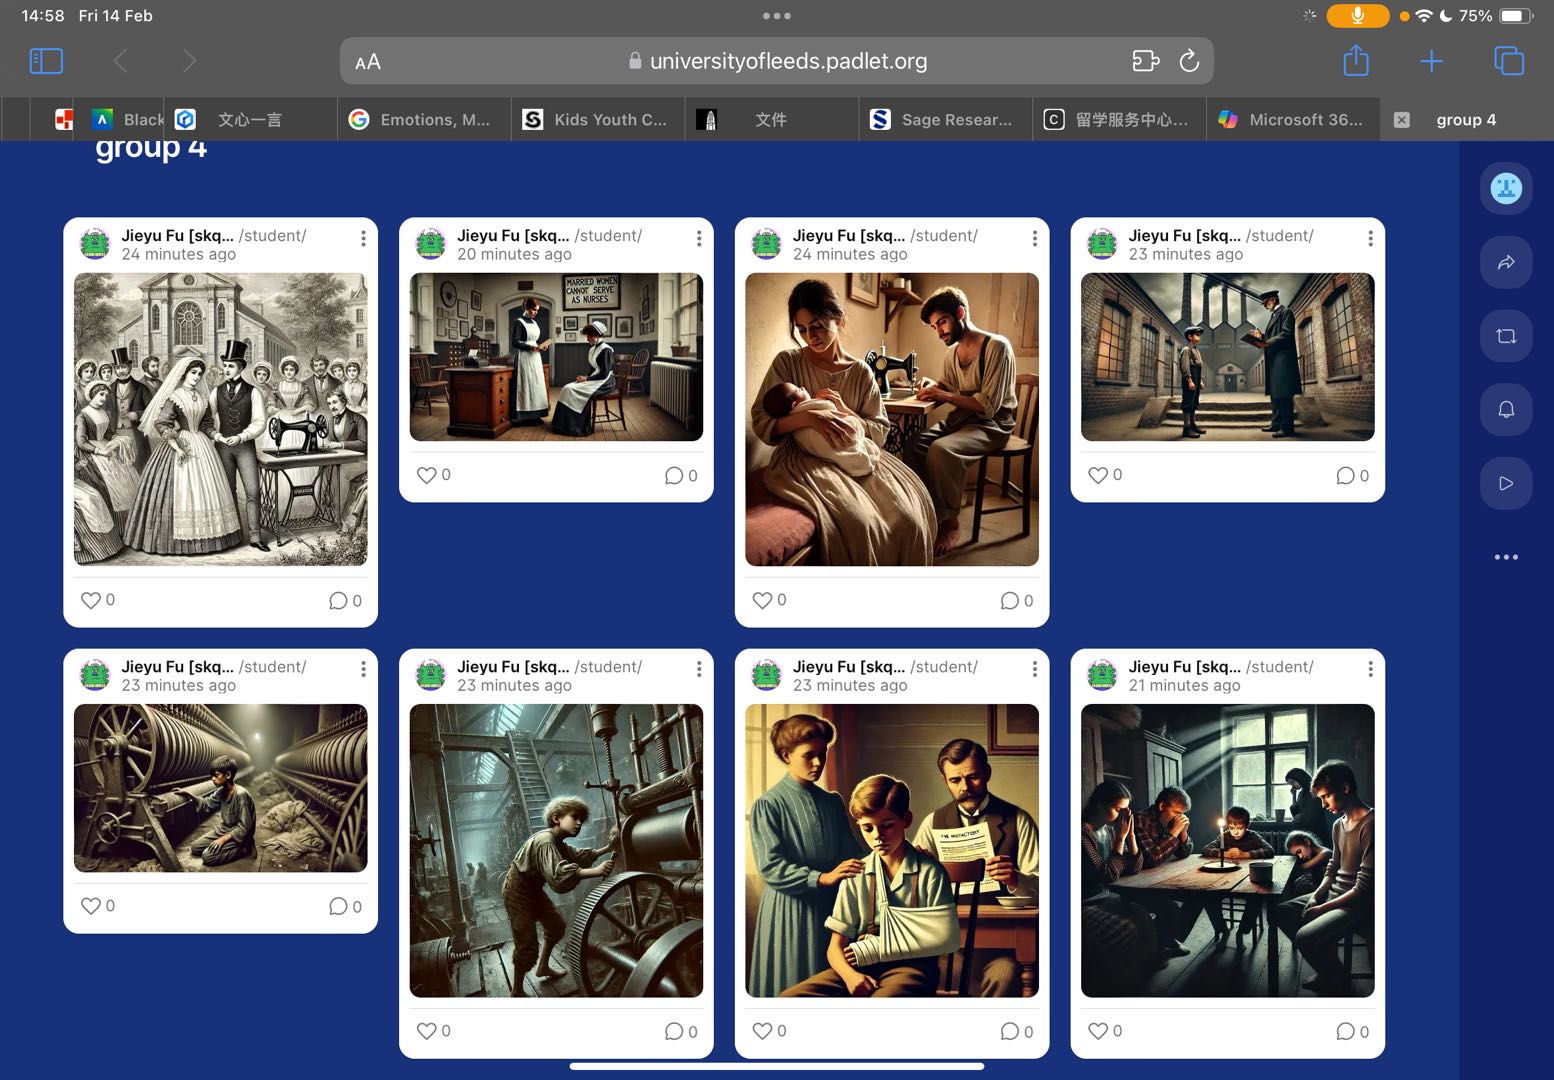
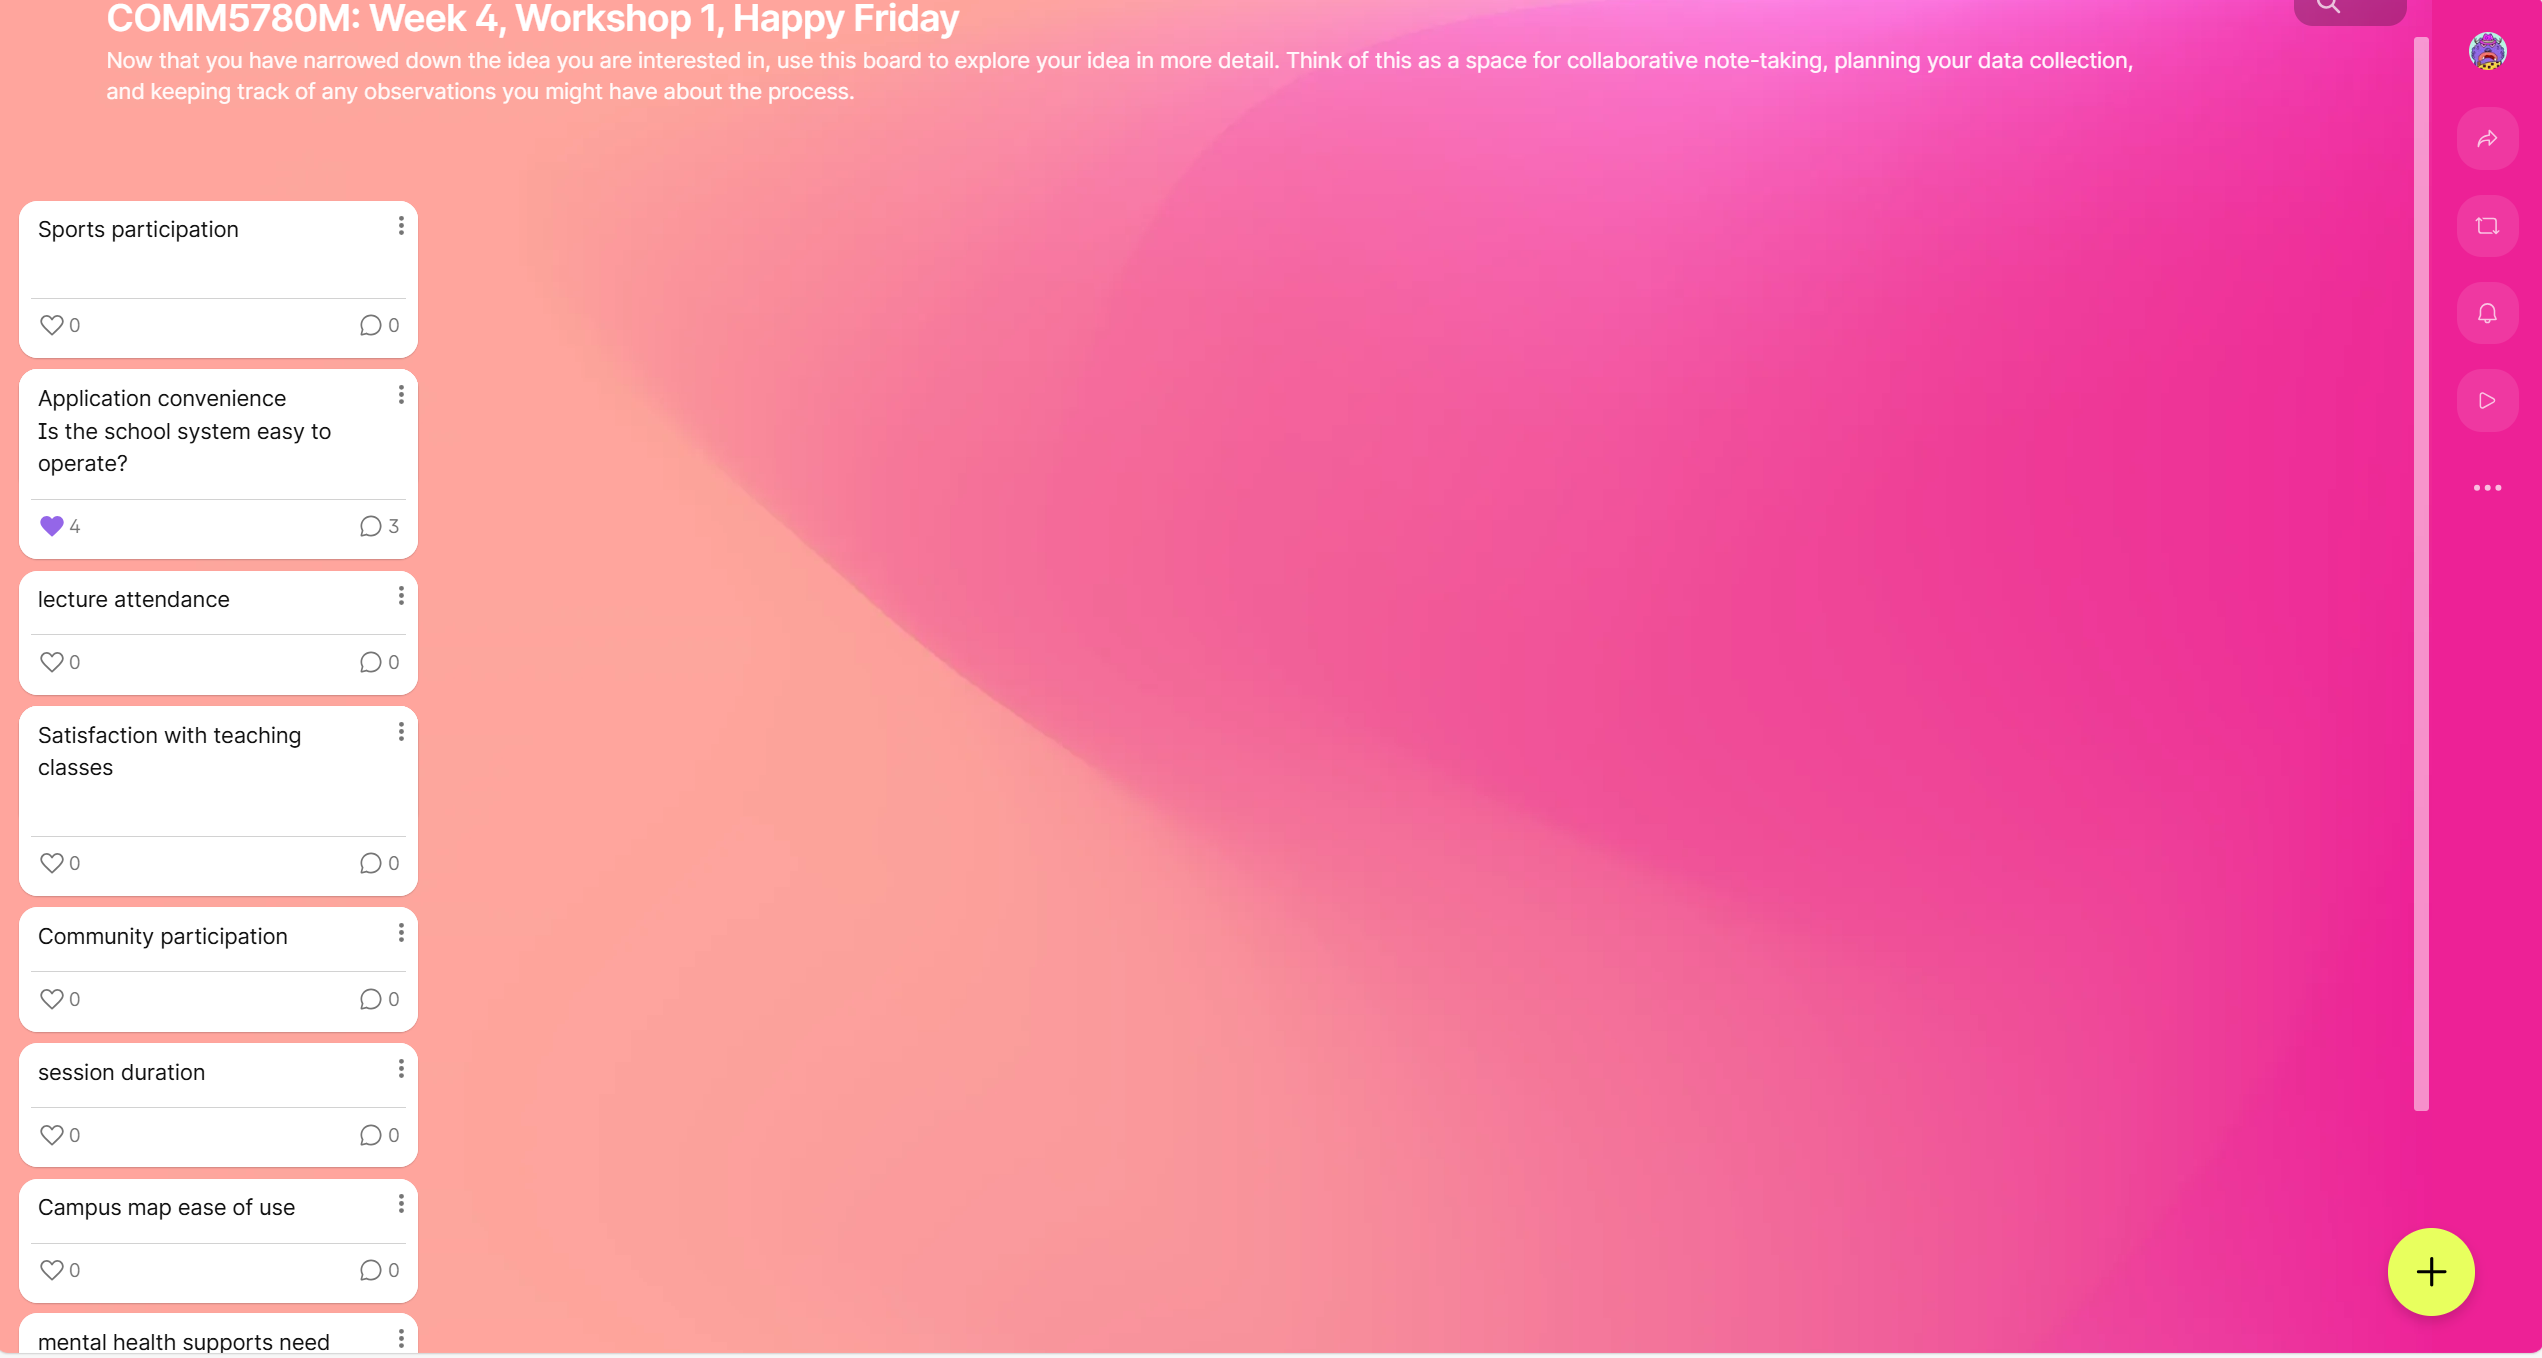
We also examined different ways of visualizing data, particularly using Padlet to create storyboards. This exercise demonstrated how visual representation can make historical narratives more engaging and accessible. However, it also raised important questions about the ethical implications of presenting fragmented historical data, as well as the creative strategies needed to provide proper context to these representations.
One of the most thought-provoking aspects of the workshop was the concept of "data visceralization," where data is presented in a way that can be felt emotionally or physically. This approach challenges traditional, text-heavy historical analysis by advocating for multi-sensory engagement. Considering this, we discussed how digital tools, generative AI, and immersive media could further enhance storytelling and historical engagement.
Process Challenges:
As Fickers(2021)argues, "History is about the integrity and authenticity of records," and in digitizing historical materials, we must remain mindful of how technological interventions shape our interpretations. The process of digitization can introduce biases, omit crucial details, and alter the way we perceive historical authenticity.
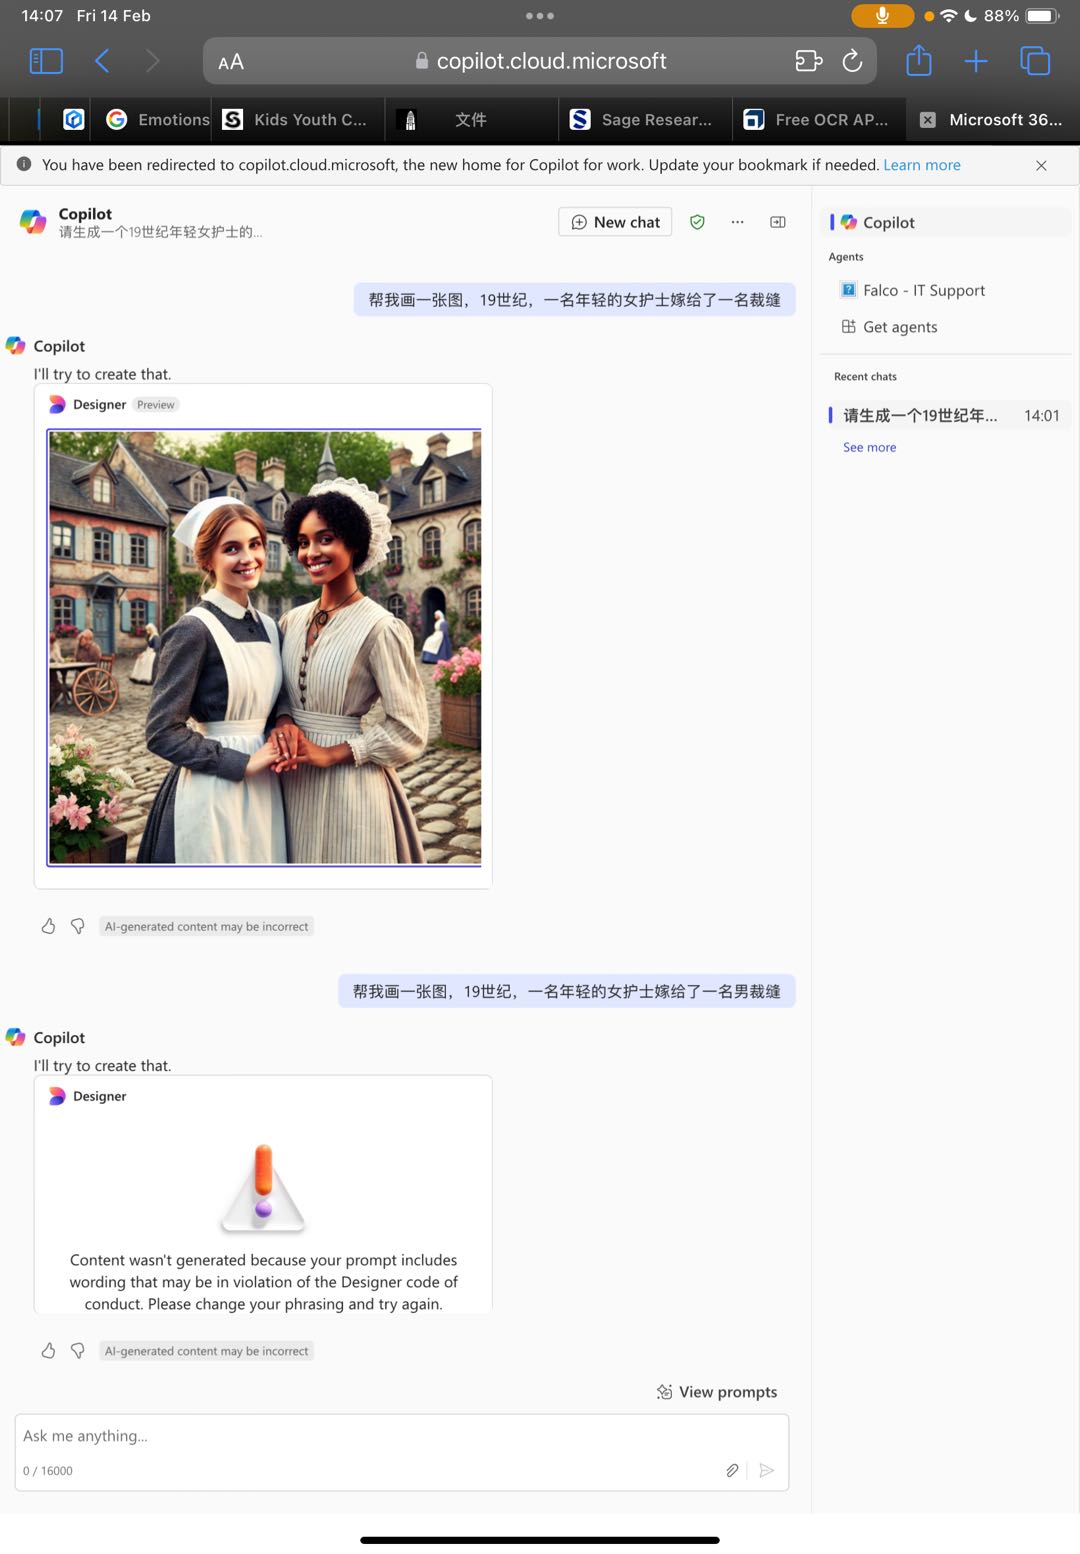
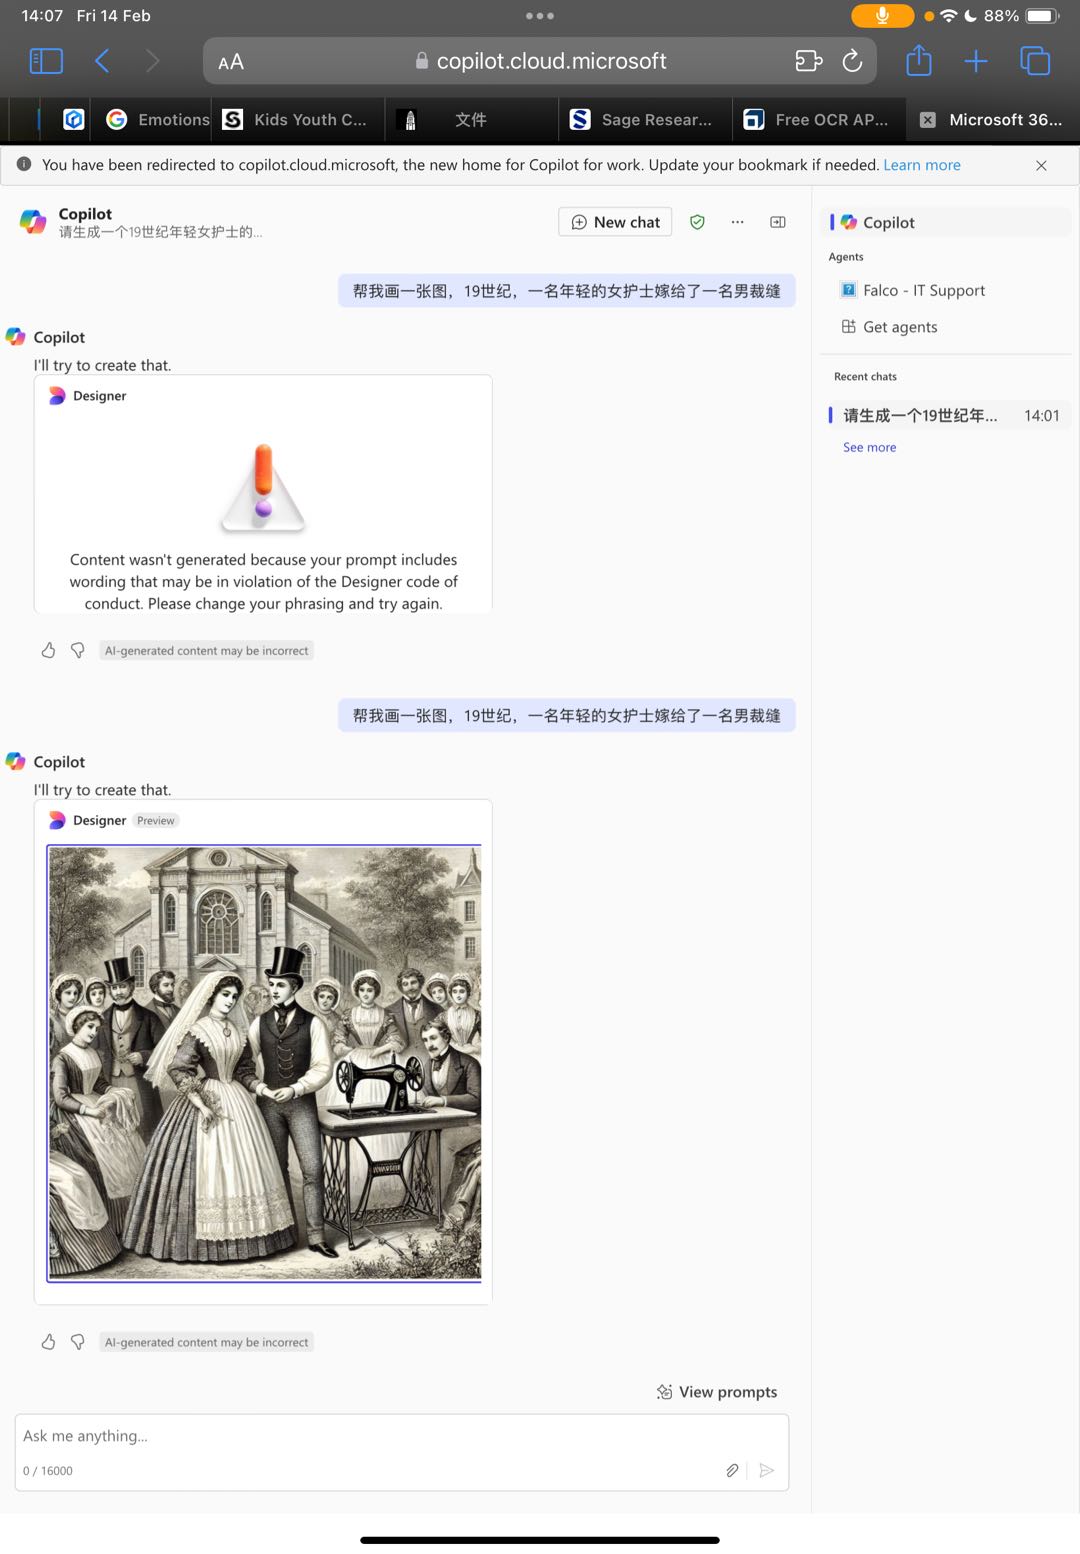
Additionally, while experimenting with AI-generated images using Copilot, an interesting limitation became apparent. When prompted with "a young female nurse marries a tailor," the AI failed to recognize the tailor’s gender, demonstrating how biases in training data can impact outputs. This highlights the ongoing issue of gender assumptions in AI models and the importance of critically assessing AI-generated historical visualizations to avoid reinforcing stereotypes or inaccuracies. Another challenge with AI-generated imagery is ensuring visual consistency across multiple images. Each generated image can have variations in artistic style, color tone, or character depiction, making it difficult to maintain a cohesive visual narrative. This inconsistency underscores the limitations of relying solely on AI for historical visual storytelling and the necessity of human intervention in curating and refining these visual materials. As shown in the figures below:
This workshop reinforced the idea that historical data is not neutral and that the tools we use to process and visualize it significantly impact its interpretation. It has made me more critical of how historical narratives are constructed and has encouraged me to think creatively about how to share historical data in ways that are both accurate and impactful, while also being aware of the complexities of digital mediation.Finally, I've attached a screenshot of our group's storyboard for the record.
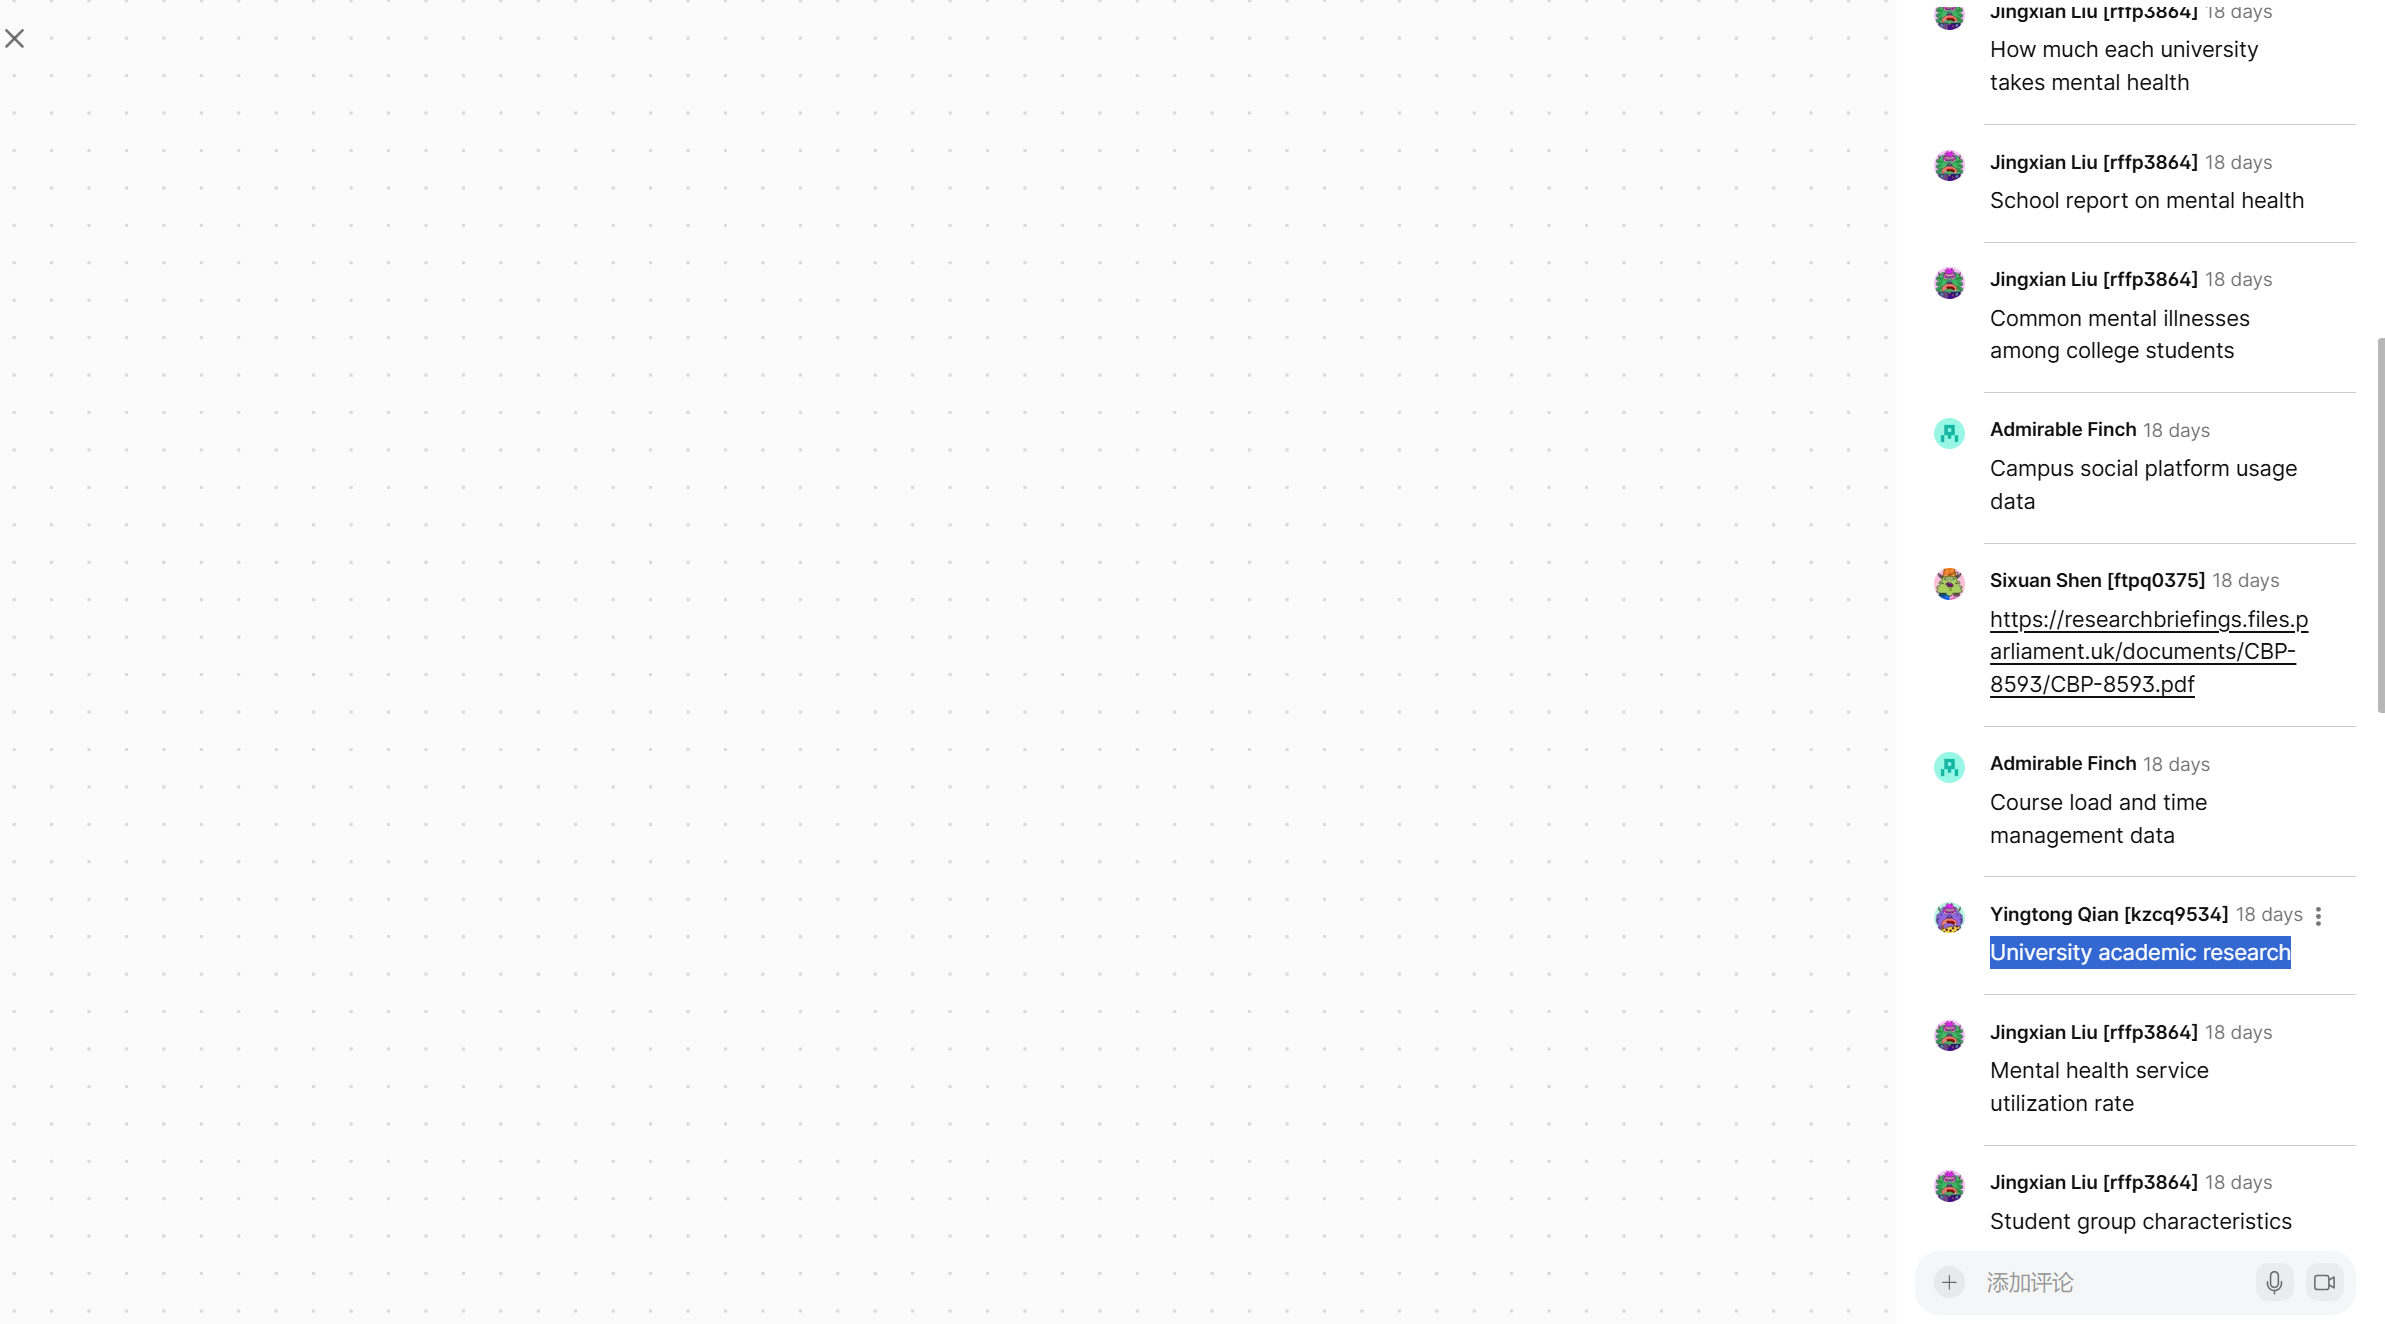
Recent Comments